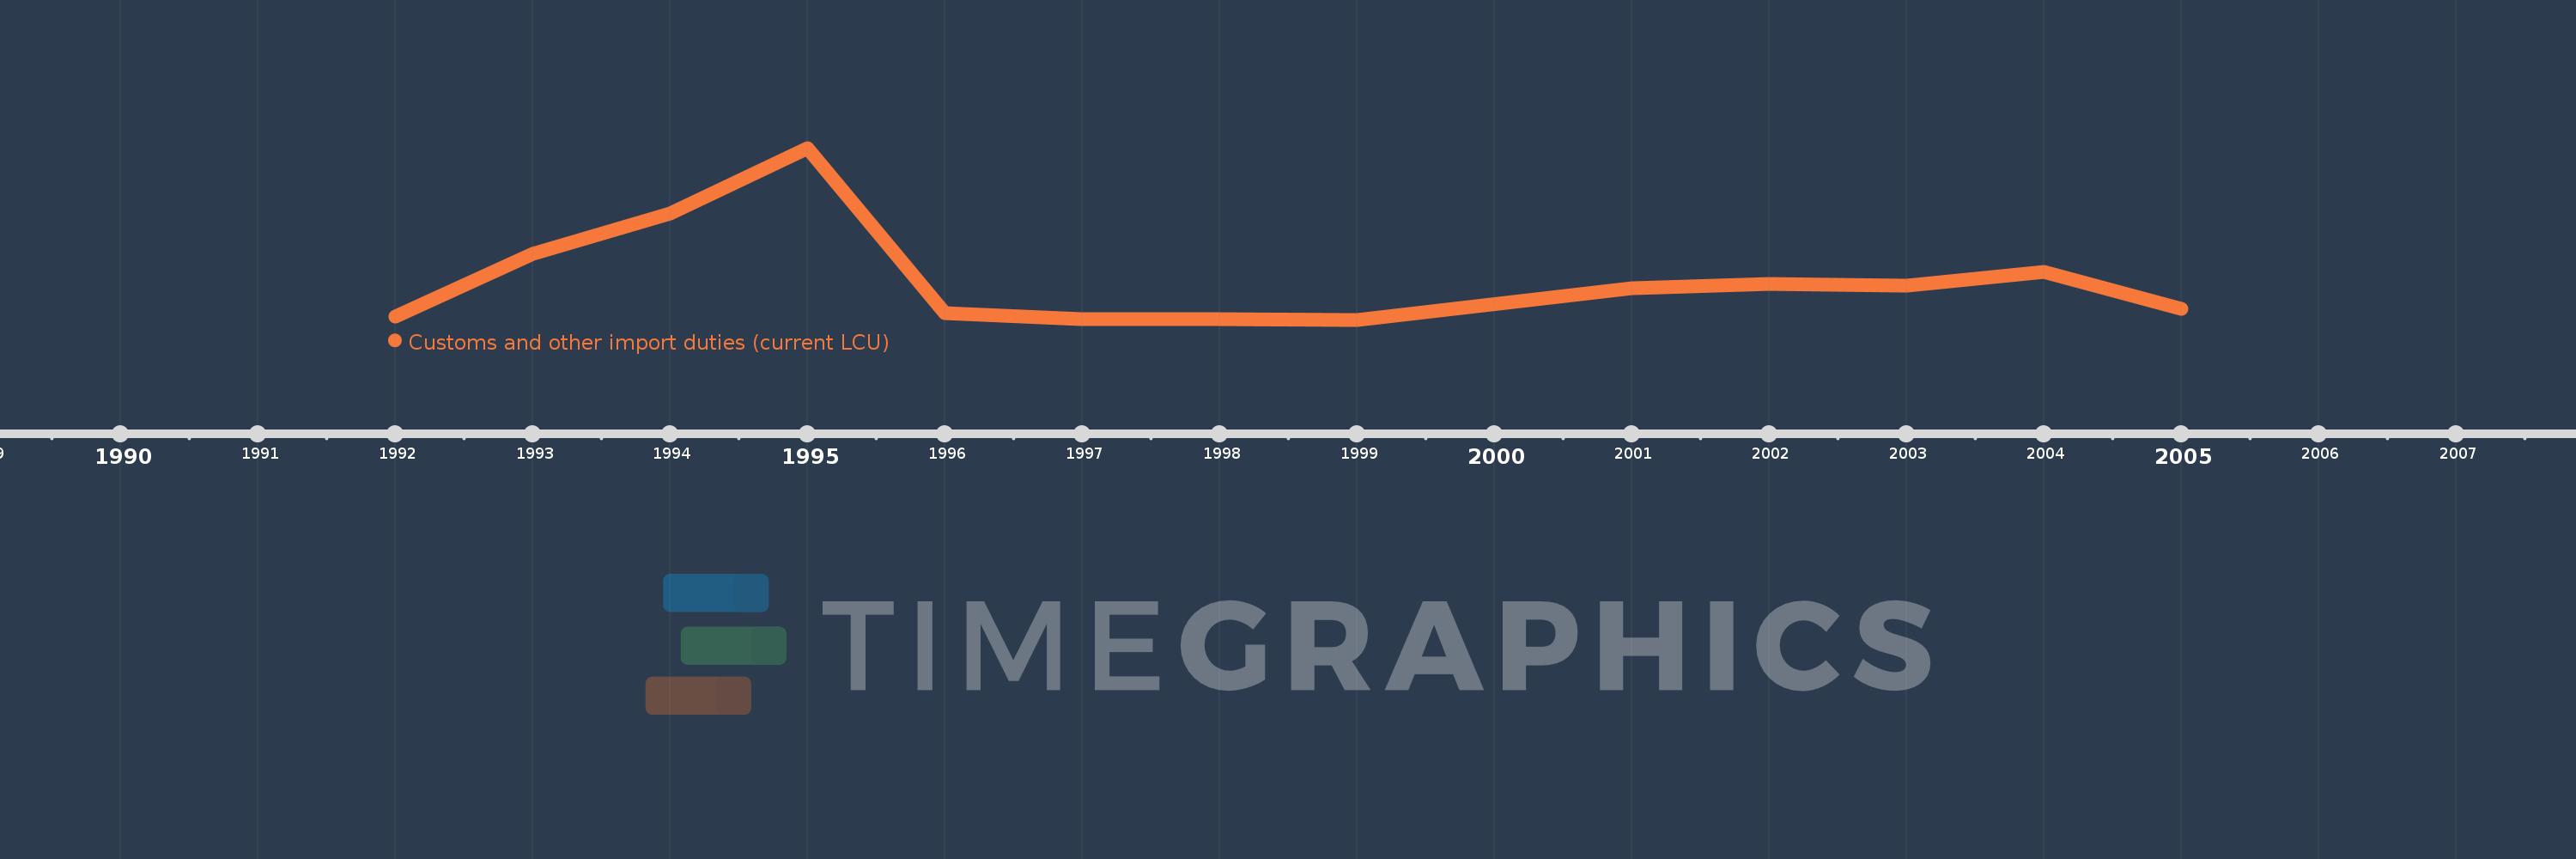
Questa scala temporale mostra un grafico dal 1992 anno al 2005 anno. Estonia. I dati fino ad 1991 anno non disponibili. Il numero di osservazioni attuali secondo i date: 13.
La fonte (nome):
Indicatori dello sviluppo mondiale
La fonte (organizzazione):
International Monetary Fund, Government Finance Statistics Yearbook and data files.
Categorie:
Public Sector
sono stati aggiornati
23 apr 2017 anni
Indicatori delle variazioni dei valori per anni
In media:
181.576 Mille.
Minima:
639.116
1 gen 1999 anni
Massimo:
785.896 Mille.
1 gen 1995 anni
Alla data di osservazione
Valore
Variazione assoluta
La variazione rispetto al valore precedente
1 gen 1992 anni
15.113 Mille.
+15.113 Mille.
0.0%
1 gen 1993 anni
303.493 Mille.
+288.38 Mille.
1.91 Mille.%
1 gen 1994 anni
486.488 Mille.
+182.995 Mille.
60.3%
1 gen 1995 anni
785.896 Mille.
+299.408 Mille.
61.54%
1 gen 1996 anni
31.956 Mille.
-753.94 Mille.
-95.93%
1 gen 1997 anni
1.917 Mille.
-30.038 Mille.
-94.0%
1 gen 1998 anni
2.556 Mille.
+639.116
33.33%
1 gen 1999 anni
639.116
-1.917 Mille.
-75.0%
1 gen 2001 anni
144.44 Mille.
+143.801 Mille.
22.5 Mille.%
1 gen 2002 anni
163.614 Mille.
+19.173 Mille.
13.27%
1 gen 2003 anni
156.584 Mille.
-7.03 Mille.
-4.3%
1 gen 2004 anni
217.939 Mille.
+61.355 Mille.
39.18%
1 gen 2005 anni
49.851 Mille.
-168.088 Mille.
-77.13%
Classificazione dei paesi secondo i statistiche attuali per anni