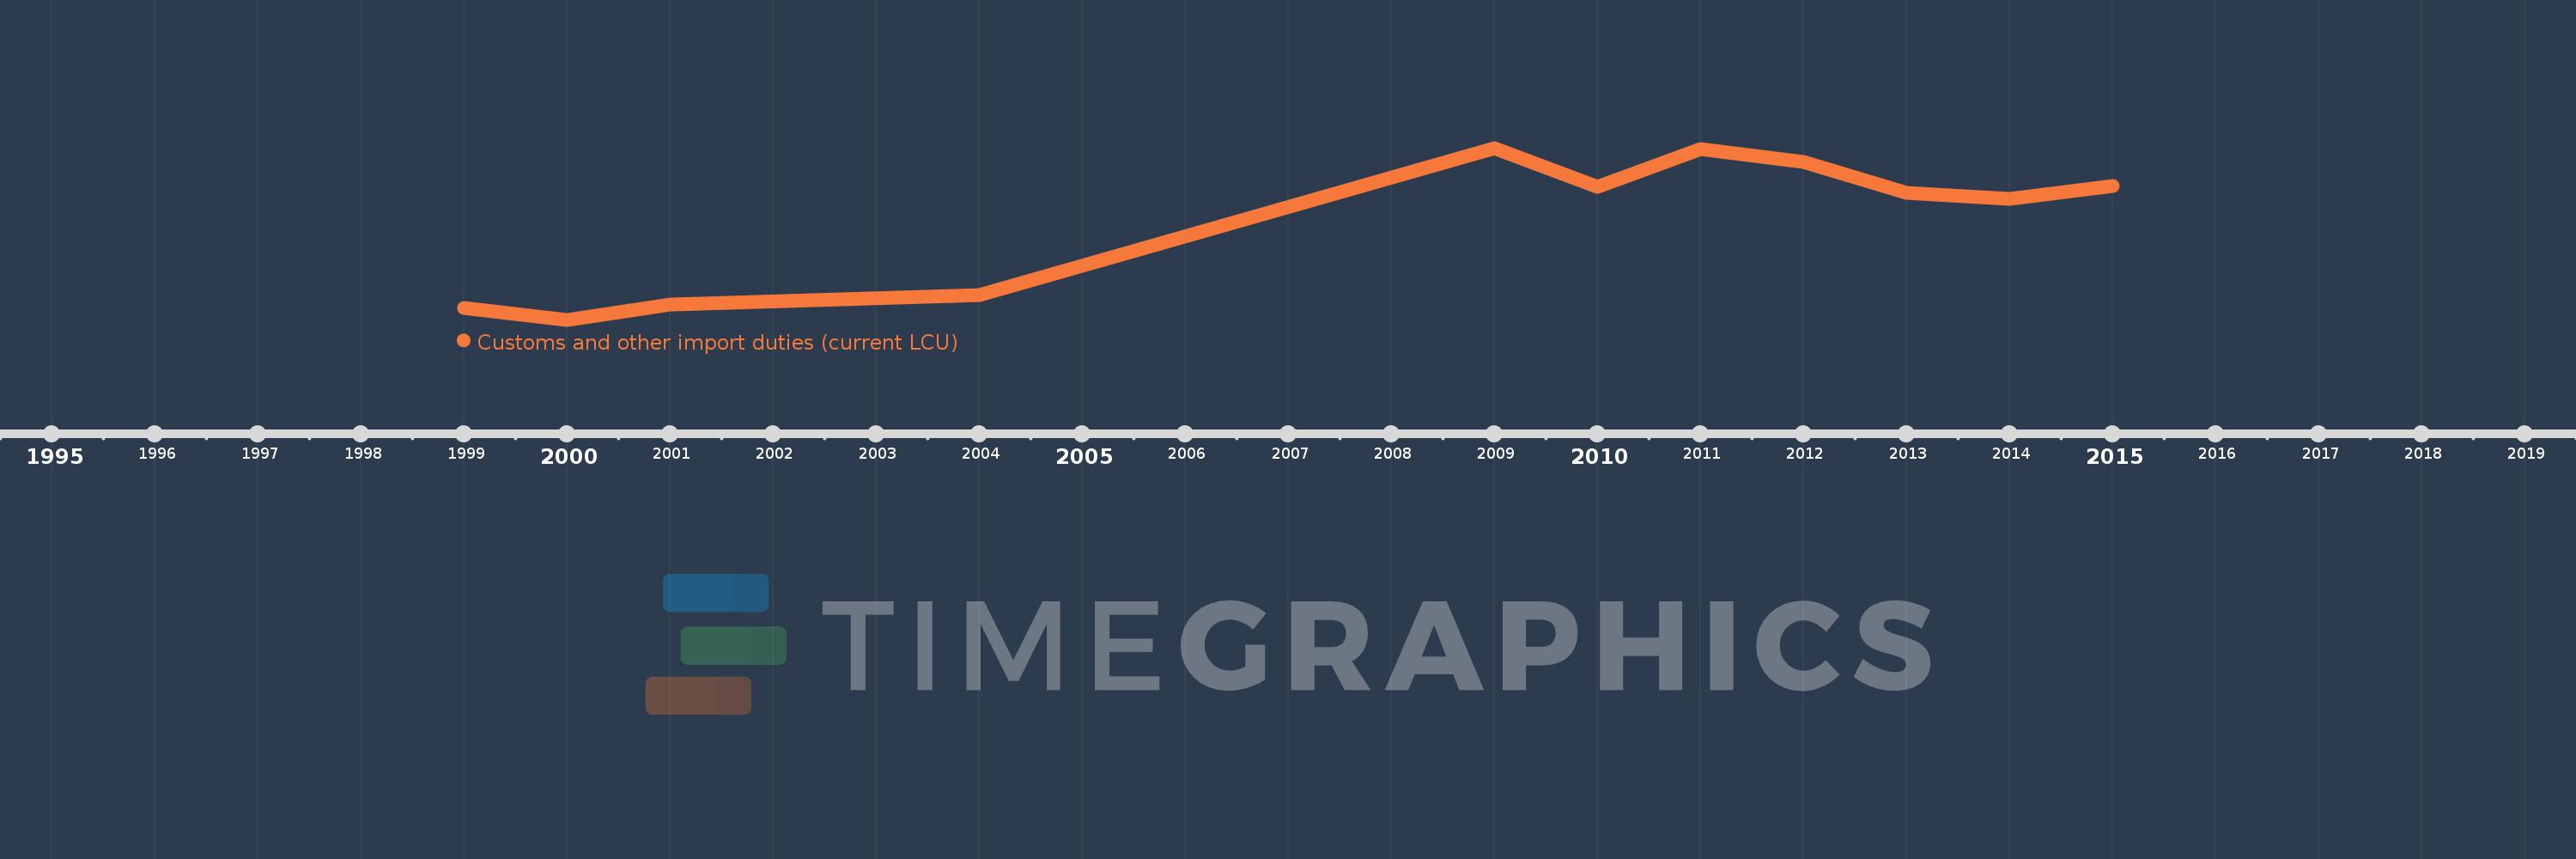
Questa scala temporale mostra un grafico dal 1999 anno al 2015 anno. Colombia. I dati fino ad 1998 anno non disponibili. Il numero di osservazioni attuali secondo i date: 11.
La fonte (nome):
Indicatori dello sviluppo mondiale
La fonte (organizzazione):
International Monetary Fund, Government Finance Statistics Yearbook and data files.
Categorie:
Public Sector
sono stati aggiornati
23 apr 2017 anni
Indicatori delle variazioni dei valori per anni
In media:
3.708 Trln
Minima:
1.373 Trln
1 gen 2000 anni
Massimo:
5.516 Trln
1 gen 2009 anni
Alla data di osservazione
Valore
Variazione assoluta
La variazione rispetto al valore precedente
1 gen 1999 anni
1.647 Trln
+1.647 Trln
0.0%
1 gen 2000 anni
1.373 Trln
-274.02 Mlrd
-16.64%
1 gen 2001 anni
1.744 Trln
+371.476 Mlrd
27.06%
1 gen 2004 anni
1.967 Trln
+223.357 Mlrd
12.81%
1 gen 2009 anni
5.516 Trln
+3.548 Trln
180.36%
1 gen 2010 anni
4.58 Trln
-935.438 Mlrd
-16.96%
1 gen 2011 anni
5.483 Trln
+902.176 Mlrd
19.7%
1 gen 2012 anni
5.169 Trln
-313.29 Mlrd
-5.71%
1 gen 2013 anni
4.429 Trln
-740.722 Mlrd
-14.33%
1 gen 2014 anni
4.286 Trln
-143.048 Mlrd
-3.23%
1 gen 2015 anni
4.599 Trln
+313.51 Mlrd
7.32%
Classificazione dei paesi secondo i statistiche attuali per anni