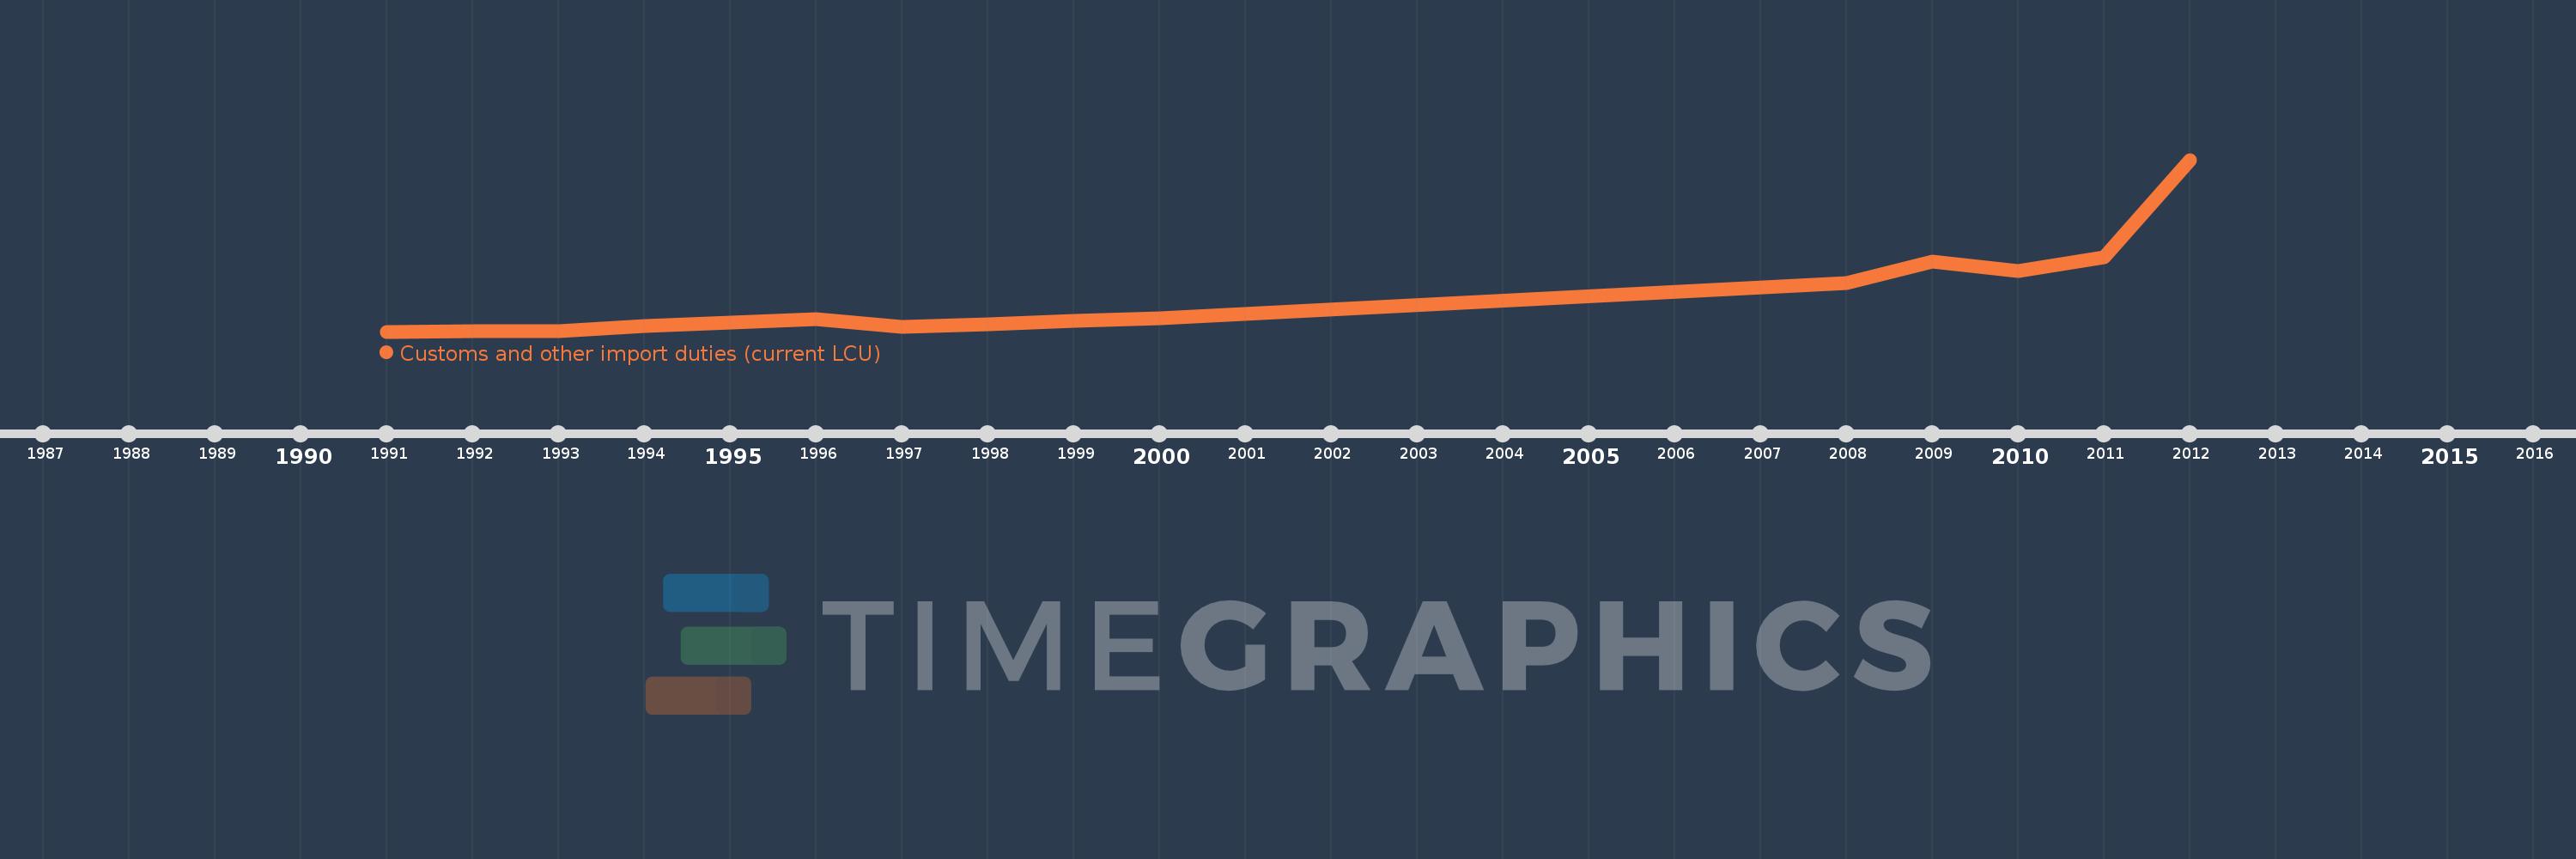
Questa scala temporale mostra un grafico dal 1991 anno al 2012 anno. Zambia. I dati fino ad 1990 anno non disponibili. Il numero di osservazioni attuali secondo i date: 15.
La fonte (nome):
Indicatori dello sviluppo mondiale
La fonte (organizzazione):
International Monetary Fund, Government Finance Statistics Yearbook and data files.
Categorie:
Public Sector
sono stati aggiornati
23 apr 2017 anni
Indicatori delle variazioni dei valori per anni
In media:
555.537 Mln
Minima:
3.959 Mln
1 gen 1991 anni
Massimo:
2.906 Mlrd
1 gen 2012 anni
Alla data di osservazione
Valore
Variazione assoluta
La variazione rispetto al valore precedente
1 gen 1991 anni
3.959 Mln
+3.959 Mln
0.0%
1 gen 1992 anni
12.191 Mln
+8.232 Mln
207.93%
1 gen 1993 anni
18.424 Mln
+6.233 Mln
51.13%
1 gen 1994 anni
91.811 Mln
+73.387 Mln
398.33%
1 gen 1995 anni
161.9 Mln
+70.089 Mln
76.34%
1 gen 1996 anni
216.9 Mln
+55.0 Mln
33.97%
1 gen 1997 anni
90.0 Mln
-126.9 Mln
-58.51%
1 gen 1998 anni
123.7 Mln
+33.7 Mln
37.44%
1 gen 1999 anni
183.9 Mln
+60.2 Mln
48.67%
1 gen 2000 anni
236.0 Mln
+52.1 Mln
28.33%
1 gen 2008 anni
821.338 Mln
+585.338 Mln
248.02%
1 gen 2009 anni
1.183 Mlrd
+361.164 Mln
43.97%
1 gen 2010 anni
1.023 Mlrd
-159.042 Mln
-13.45%
1 gen 2011 anni
1.261 Mlrd
+237.709 Mln
23.23%
1 gen 2012 anni
2.906 Mlrd
+1.645 Mlrd
130.41%
Classificazione dei paesi secondo i statistiche attuali per anni