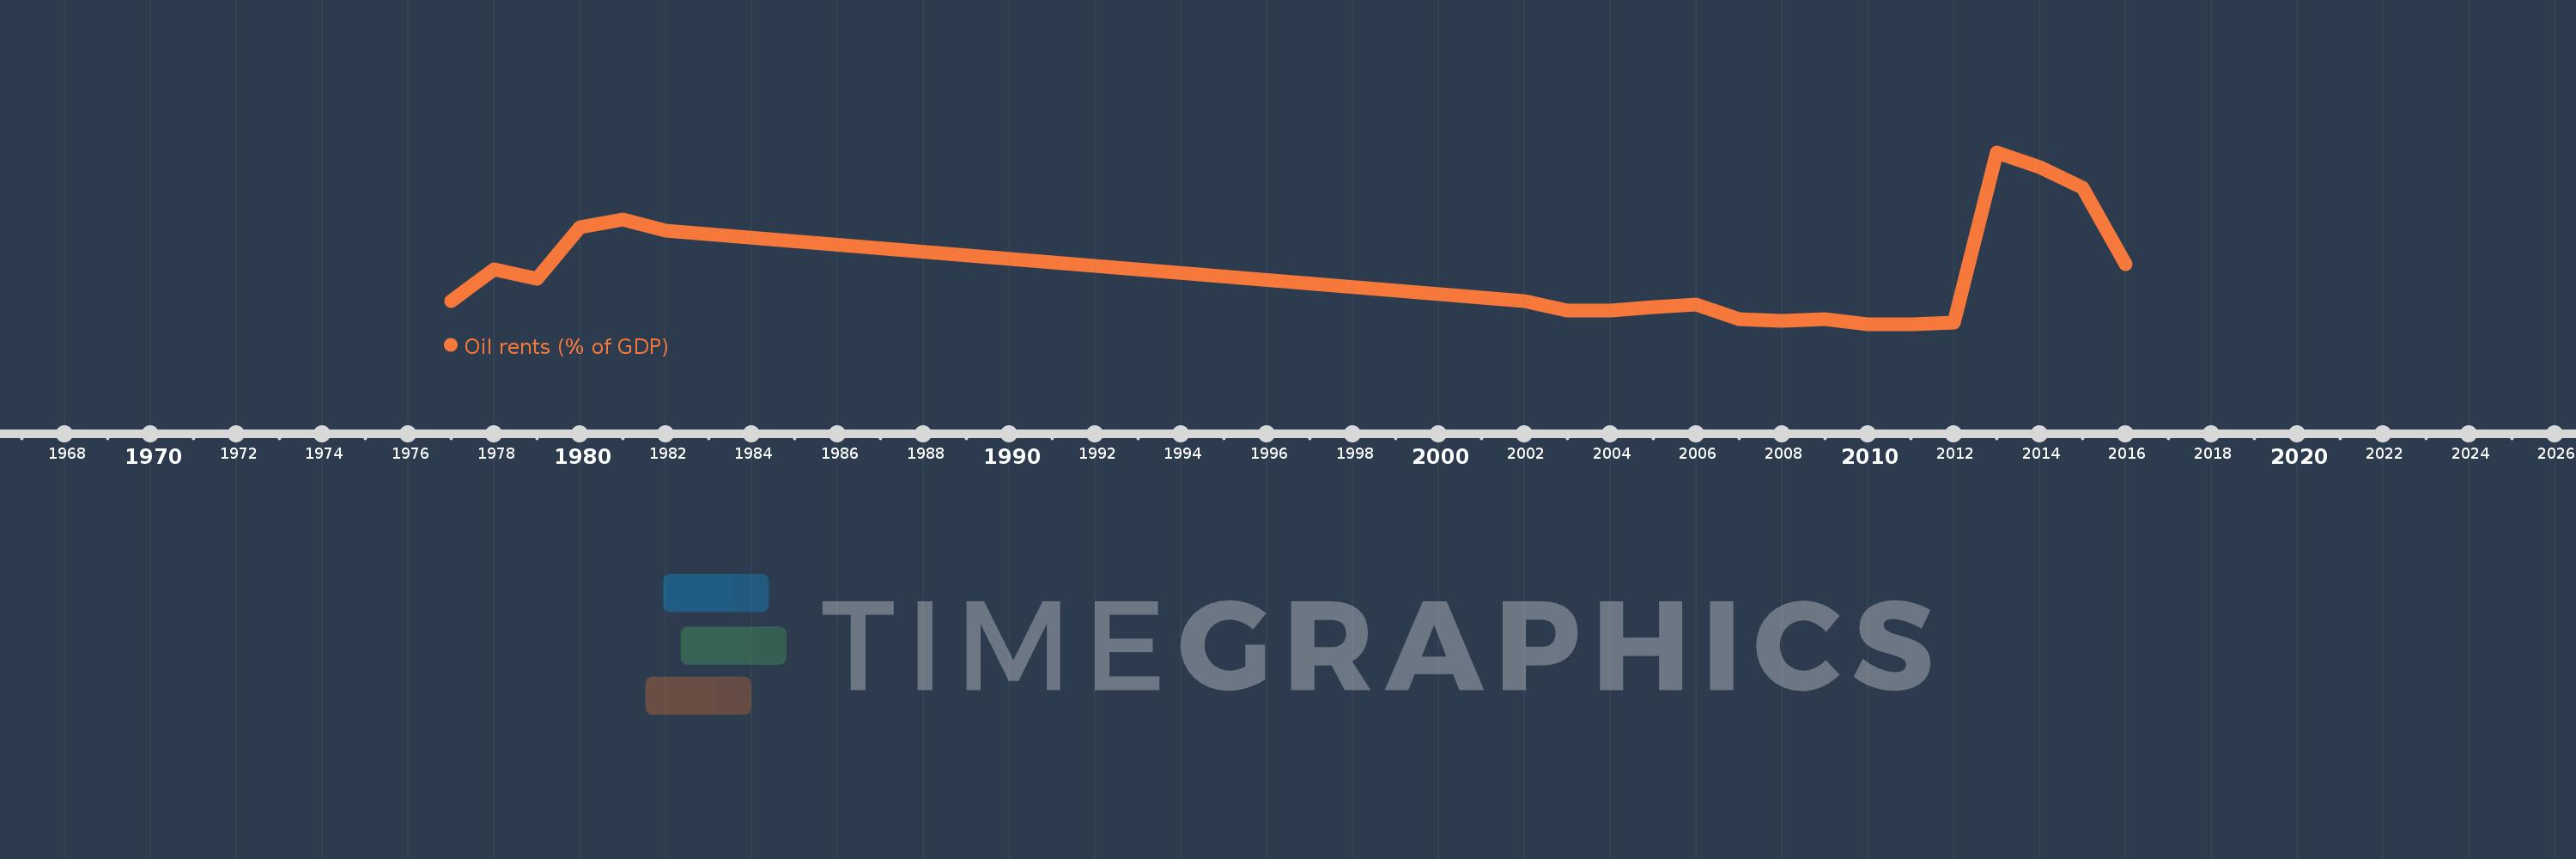
Questa scala temporale mostra un grafico dal 1977 anno al 2016 anno. Afghanistan. I dati fino ad 1976 anno non disponibili. Il numero di osservazioni attuali secondo i date: 21.
La fonte (nome):
Indicatori dello sviluppo mondiale
La fonte (organizzazione):
Estimates based on sources and methods described in "The Changing Wealth of Nations: Measuring Sustainable Development in the New Millennium" (World Bank, 2011).
Categorie:
Energy & Mining, Environment
sono stati aggiornati
23 apr 2017 anni
Indicatori delle variazioni dei valori per anni
In media:
0.032
Minima:
0.002
1 gen 2010 anni
Massimo:
0.105
1 gen 2013 anni
Alla data di osservazione
Valore
Variazione assoluta
La variazione rispetto al valore precedente
1 gen 1977 anni
0.016
+0.016
0.0%
1 gen 1978 anni
0.035
+0.019
124.24%
1 gen 1979 anni
0.029
-0.006
-16.15%
1 gen 1980 anni
0.06
+0.031
106.18%
1 gen 1981 anni
0.065
+0.005
8.44%
1 gen 1982 anni
0.058
-0.007
-10.38%
1 gen 2002 anni
0.016
-0.042
-72.16%
1 gen 2003 anni
0.01
-0.006
-38.36%
1 gen 2004 anni
0.01
+0.0
2.42%
1 gen 2005 anni
0.012
+0.002
14.75%
1 gen 2006 anni
0.014
+0.002
20.14%
1 gen 2007 anni
0.005
-0.009
-62.47%
1 gen 2008 anni
0.004
-0.001
-21.97%
1 gen 2009 anni
0.005
+0.001
27.75%
1 gen 2010 anni
0.002
-0.003
-57.69%
1 gen 2011 anni
0.002
+0.0
6.11%
1 gen 2012 anni
0.003
+0.001
35.85%
1 gen 2013 anni
0.105
+0.102
3.15 Mille.%
1 gen 2014 anni
0.096
-0.009
-8.69%
1 gen 2015 anni
0.084
-0.012
-12.92%
1 gen 2016 anni
0.038
-0.046
-54.9%
Classificazione dei paesi secondo i statistiche attuali per anni