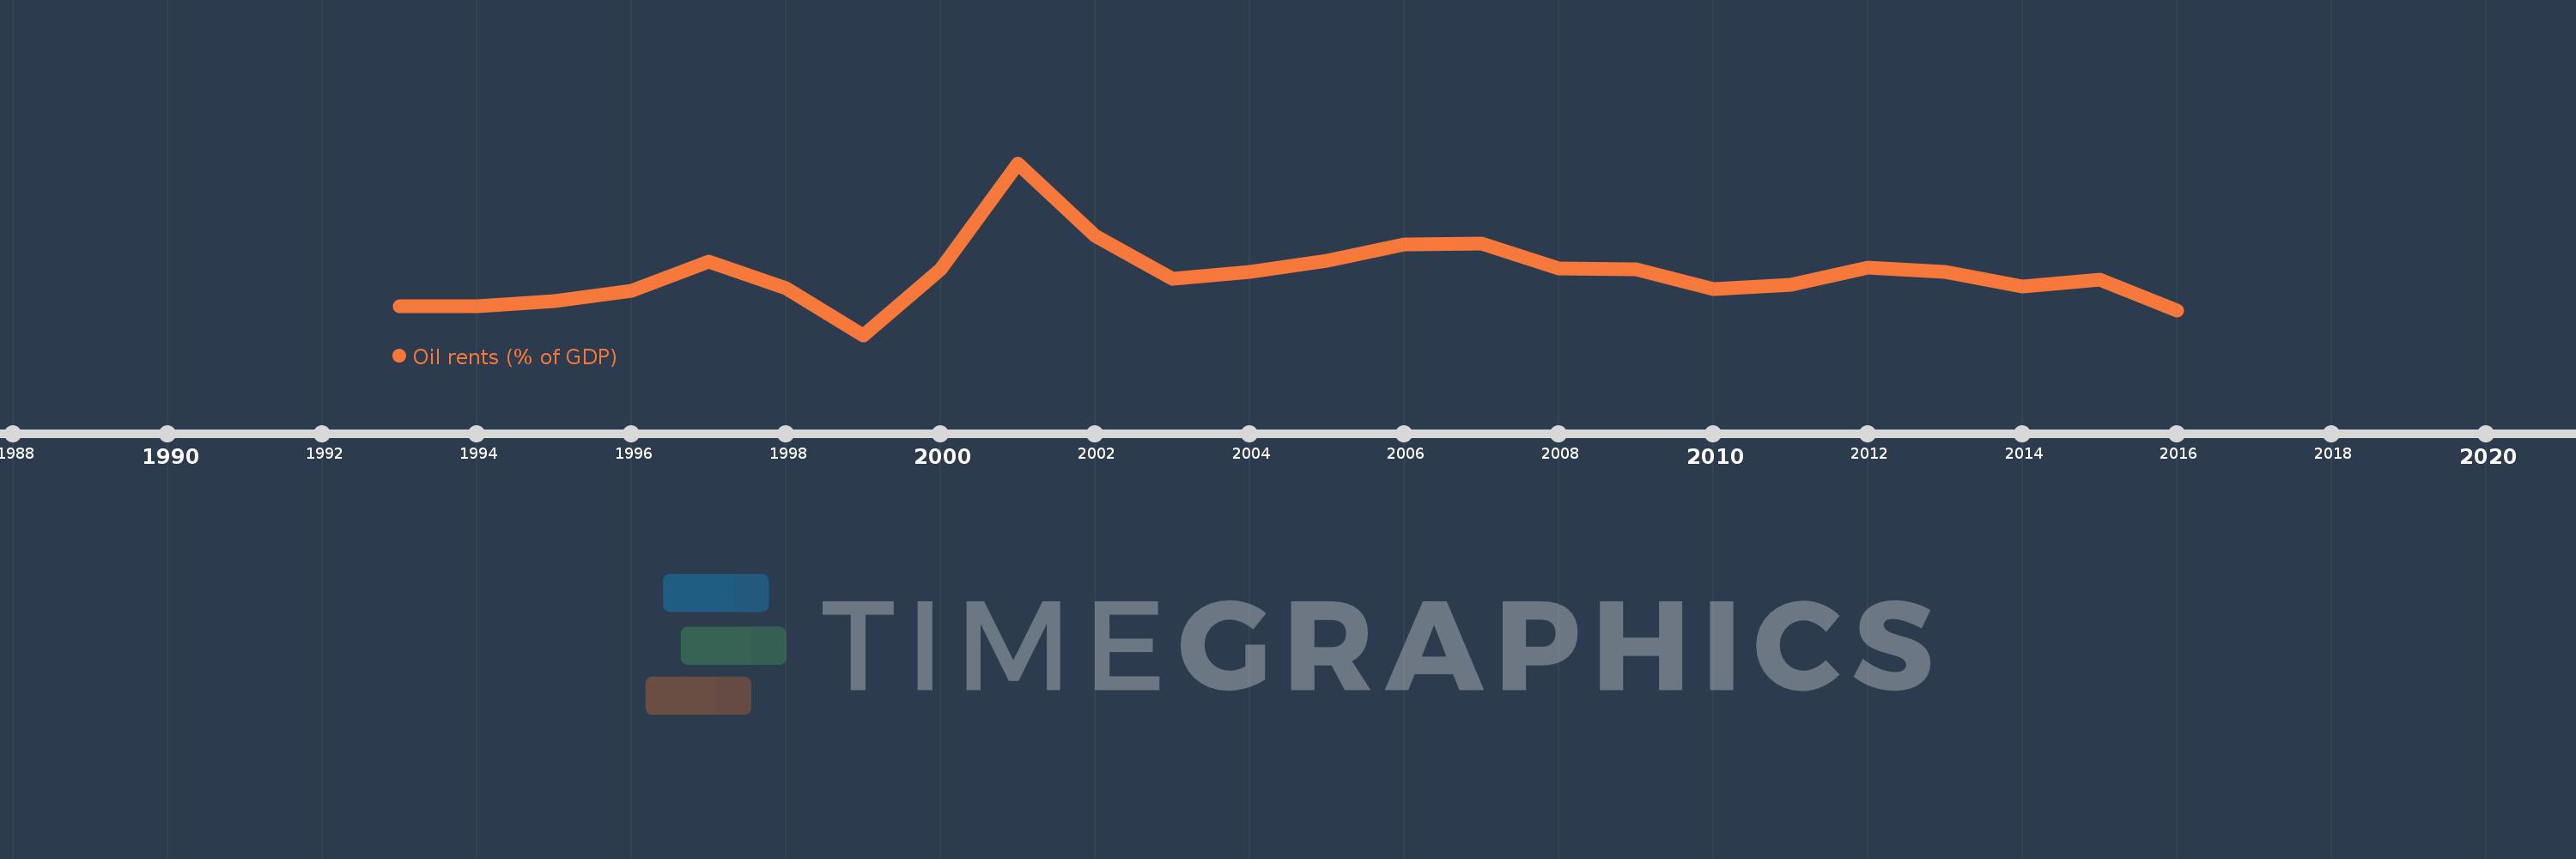
Questa scala temporale mostra un grafico dal 1993 anno al 2016 anno. Ukraine. I dati fino ad 1992 anno non disponibili. Il numero di osservazioni attuali secondo i date: 24.
La fonte (nome):
Indicatori dello sviluppo mondiale
La fonte (organizzazione):
Estimates based on sources and methods described in "The Changing Wealth of Nations: Measuring Sustainable Development in the New Millennium" (World Bank, 2011).
Categorie:
Energy & Mining, Environment
sono stati aggiornati
23 apr 2017 anni
Indicatori delle variazioni dei valori per anni
In media:
0.555
Minima:
0.11
1 gen 1999 anni
Massimo:
1.37
1 gen 2001 anni
Alla data di osservazione
Valore
Variazione assoluta
La variazione rispetto al valore precedente
1 gen 1993 anni
0.318
+0.318
0.0%
1 gen 1994 anni
0.322
+0.005
1.45%
1 gen 1995 anni
0.359
+0.037
11.35%
1 gen 1996 anni
0.434
+0.075
21.0%
1 gen 1997 anni
0.649
+0.215
49.46%
1 gen 1998 anni
0.452
-0.197
-30.3%
1 gen 1999 anni
0.11
-0.343
-75.78%
1 gen 2000 anni
0.591
+0.481
439.37%
1 gen 2001 anni
1.37
+0.779
131.78%
1 gen 2002 anni
0.839
-0.531
-38.74%
1 gen 2003 anni
0.524
-0.315
-37.54%
1 gen 2004 anni
0.576
+0.052
9.89%
1 gen 2005 anni
0.655
+0.079
13.68%
1 gen 2006 anni
0.772
+0.117
17.91%
1 gen 2007 anni
0.78
+0.008
1.06%
1 gen 2008 anni
0.601
-0.179
-22.96%
1 gen 2009 anni
0.59
-0.011
-1.91%
1 gen 2010 anni
0.445
-0.144
-24.5%
1 gen 2011 anni
0.481
+0.036
7.98%
1 gen 2012 anni
0.603
+0.122
25.38%
1 gen 2013 anni
0.572
-0.03
-5.06%
1 gen 2014 anni
0.468
-0.104
-18.25%
1 gen 2015 anni
0.515
+0.047
10.04%
1 gen 2016 anni
0.287
-0.227
-44.19%
Classificazione dei paesi secondo i statistiche attuali per anni