33
/it/
AIzaSyAYiBZKx7MnpbEhh9jyipgxe19OcubqV5w
August 1, 2025
127676
Equatorial Guinea
GNQ
true
2
1
Oil rents (% of GDP)
2016,2015,2014,2013,2012,2011,2010,2009,2008,2007,2006,2005,2004,2003,2002,2001,2000,1999,1998,1997,1996,1995,1994,1993,1992
Download
Biblioteca di statistiche globali →Equatorial Guinea →

Oil rents (% of GDP)

Queste statistiche in altri paesi:

AfghanistanAlbaniaAlgeriaAngolaArab WorldArgentinaArmeniaAustraliaAustriaAzerbaijanBahrainBangladeshBarbadosBelarusBelgiumBelizeBeninBoliviaBosnia and HerzegovinaBotswanaBrazilBrunei DarussalamBulgariaCambodiaCameroonCanadaCaribbean small statesCentral Europe and the BalticsChadChileChinaColombiaCongo, Dem. Rep.Congo, Rep.Costa RicaCote d'IvoireCroatiaCubaCyprusCzech RepublicDenmarkDominican RepublicEarly-demographic dividendEast Asia & PacificEast Asia & Pacific (excluding high income)East Asia & Pacific (IDA & IBRD countries)EcuadorEgypt, Arab Rep.El SalvadorEquatorial GuineaEritreaEstoniaEthiopiaEuro areaEurope & Central AsiaEurope & Central Asia (excluding high income)Europe & Central Asia (IDA & IBRD countries)European UnionFinlandFragile and conflict affected situationsFranceGabonGeorgiaGermanyGhanaGreeceGuatemalaHaitiHeavily indebted poor countries (HIPC)High incomeHondurasHungaryIBRD onlyIcelandIDA & IBRD totalIDA blendIDA onlyIDA totalIndiaIndonesiaIran, Islamic Rep.IraqIrelandIsraelItalyJamaicaJapanJordanKazakhstanKenyaKorea, Rep.KosovoKuwaitKyrgyz RepublicLate-demographic dividendLatin America & Caribbean Latin America & Caribbean (excluding high income)Latin America & the Caribbean (IDA & IBRD countries)LatviaLeast developed countries: UN classificationLebanonLibyaLithuaniaLow & middle incomeLower middle incomeLuxembourgMacedonia, FYRMalaysiaMaltaMauritaniaMauritiusMexicoMiddle East & North AfricaMiddle East & North Africa (excluding high income)Middle East & North Africa (IDA & IBRD countries)Middle incomeMongoliaMontenegroMoroccoMozambiqueMyanmarNamibiaNepalNetherlandsNew ZealandNicaraguaNigerNigeriaNorth AmericaNorwayOECD membersOmanOther small statesPakistanPanamaPapua New GuineaParaguayPeruPhilippinesPolandPortugalPost-demographic dividendPre-demographic dividendQatarRomaniaRussian FederationSaudi ArabiaSenegalSerbiaSingaporeSlovak RepublicSloveniaSmall statesSouth AfricaSouth AsiaSouth Asia (IDA & IBRD)South SudanSpainSri LankaSub-Saharan Africa Sub-Saharan Africa (excluding high income)Sub-Saharan Africa (IDA & IBRD countries)SudanSurinameSwedenSwitzerlandSyrian Arab RepublicTajikistanThailandTimor-LesteTogoTrinidad and TobagoTunisiaTurkeyTurkmenistanUkraineUnited Arab EmiratesUnited KingdomUnited StatesUpper middle incomeUruguayUzbekistanVenezuela, RBVietnamWest Bank and GazaWorldYemen, Rep.ZambiaZimbabwe

Linea del tempo:

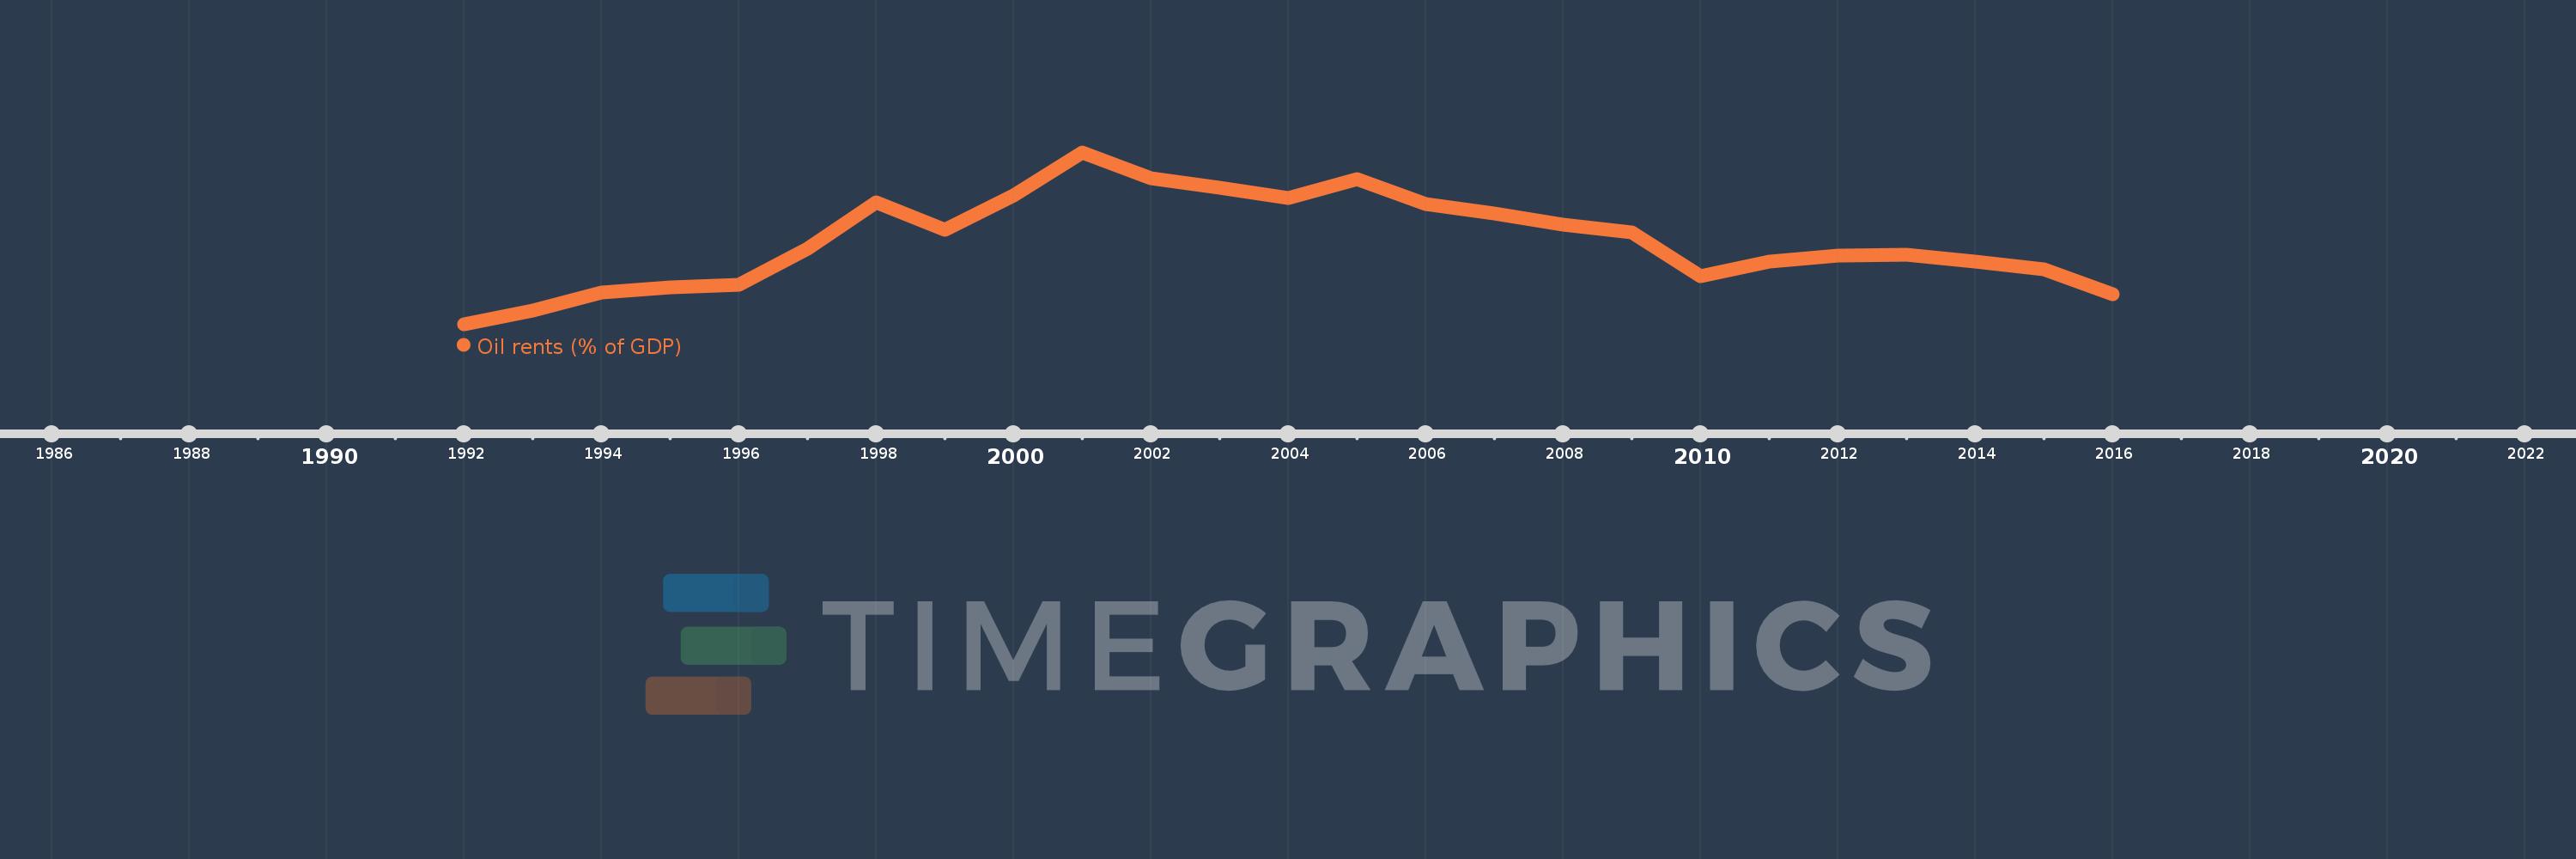
Questa scala temporale mostra un grafico dal 1992 anno al 2016 anno. Equatorial Guinea. I dati fino ad 1991 anno non disponibili. Il numero di osservazioni attuali secondo i date: 25.

La fonte (nome):

Indicatori dello sviluppo mondiale

La fonte (organizzazione):

Estimates based on sources and methods described in "The Changing Wealth of Nations: Measuring Sustainable Development in the New Millennium" (World Bank, 2011).

Categorie:

Energy & Mining, Environment

sono stati aggiornati

23 apr 2017 anni

Indicatori delle variazioni dei valori per anni

In media:
40.63
Minima:
0.381
1 gen 1992 anni
Massimo:
83.344
1 gen 2001 anni
Alla data di osservazione
Valore
Variazione assoluta
La variazione rispetto al valore precedente
1 gen 1992 anni
0.381
+0.381
0.0%
1 gen 1993 anni
6.779
+6.398
1.68 Mille.%
1 gen 1994 anni
15.517
+8.738
128.89%
1 gen 1995 anni
18.057
+2.54
16.37%
1 gen 1996 anni
19.258
+1.201
6.65%
1 gen 1997 anni
36.835
+17.576
91.27%
1 gen 1998 anni
59.4
+22.566
61.26%
1 gen 1999 anni
45.794
-13.606
-22.91%
1 gen 2000 anni
62.696
+16.902
36.91%
1 gen 2001 anni
83.344
+20.648
32.93%
1 gen 2002 anni
70.719
-12.625
-15.15%
1 gen 2003 anni
66.102
-4.617
-6.53%
1 gen 2004 anni
61.153
-4.949
-7.49%
1 gen 2005 anni
70.307
+9.155
14.97%
1 gen 2006 anni
58.479
-11.828
-16.82%
1 gen 2007 anni
53.878
-4.602
-7.87%
1 gen 2008 anni
48.495
-5.383
-9.99%
1 gen 2009 anni
44.802
-3.692
-7.61%
1 gen 2010 anni
23.622
-21.18
-47.27%
1 gen 2011 anni
30.468
+6.846
28.98%
1 gen 2012 anni
33.536
+3.067
10.07%
1 gen 2013 anni
33.872
+0.337
1.0%
1 gen 2014 anni
30.586
-3.286
-9.7%
1 gen 2015 anni
26.944
-3.642
-11.91%
1 gen 2016 anni
14.729
-12.216
-45.34%

Classificazione dei paesi secondo i statistiche attuali per anni