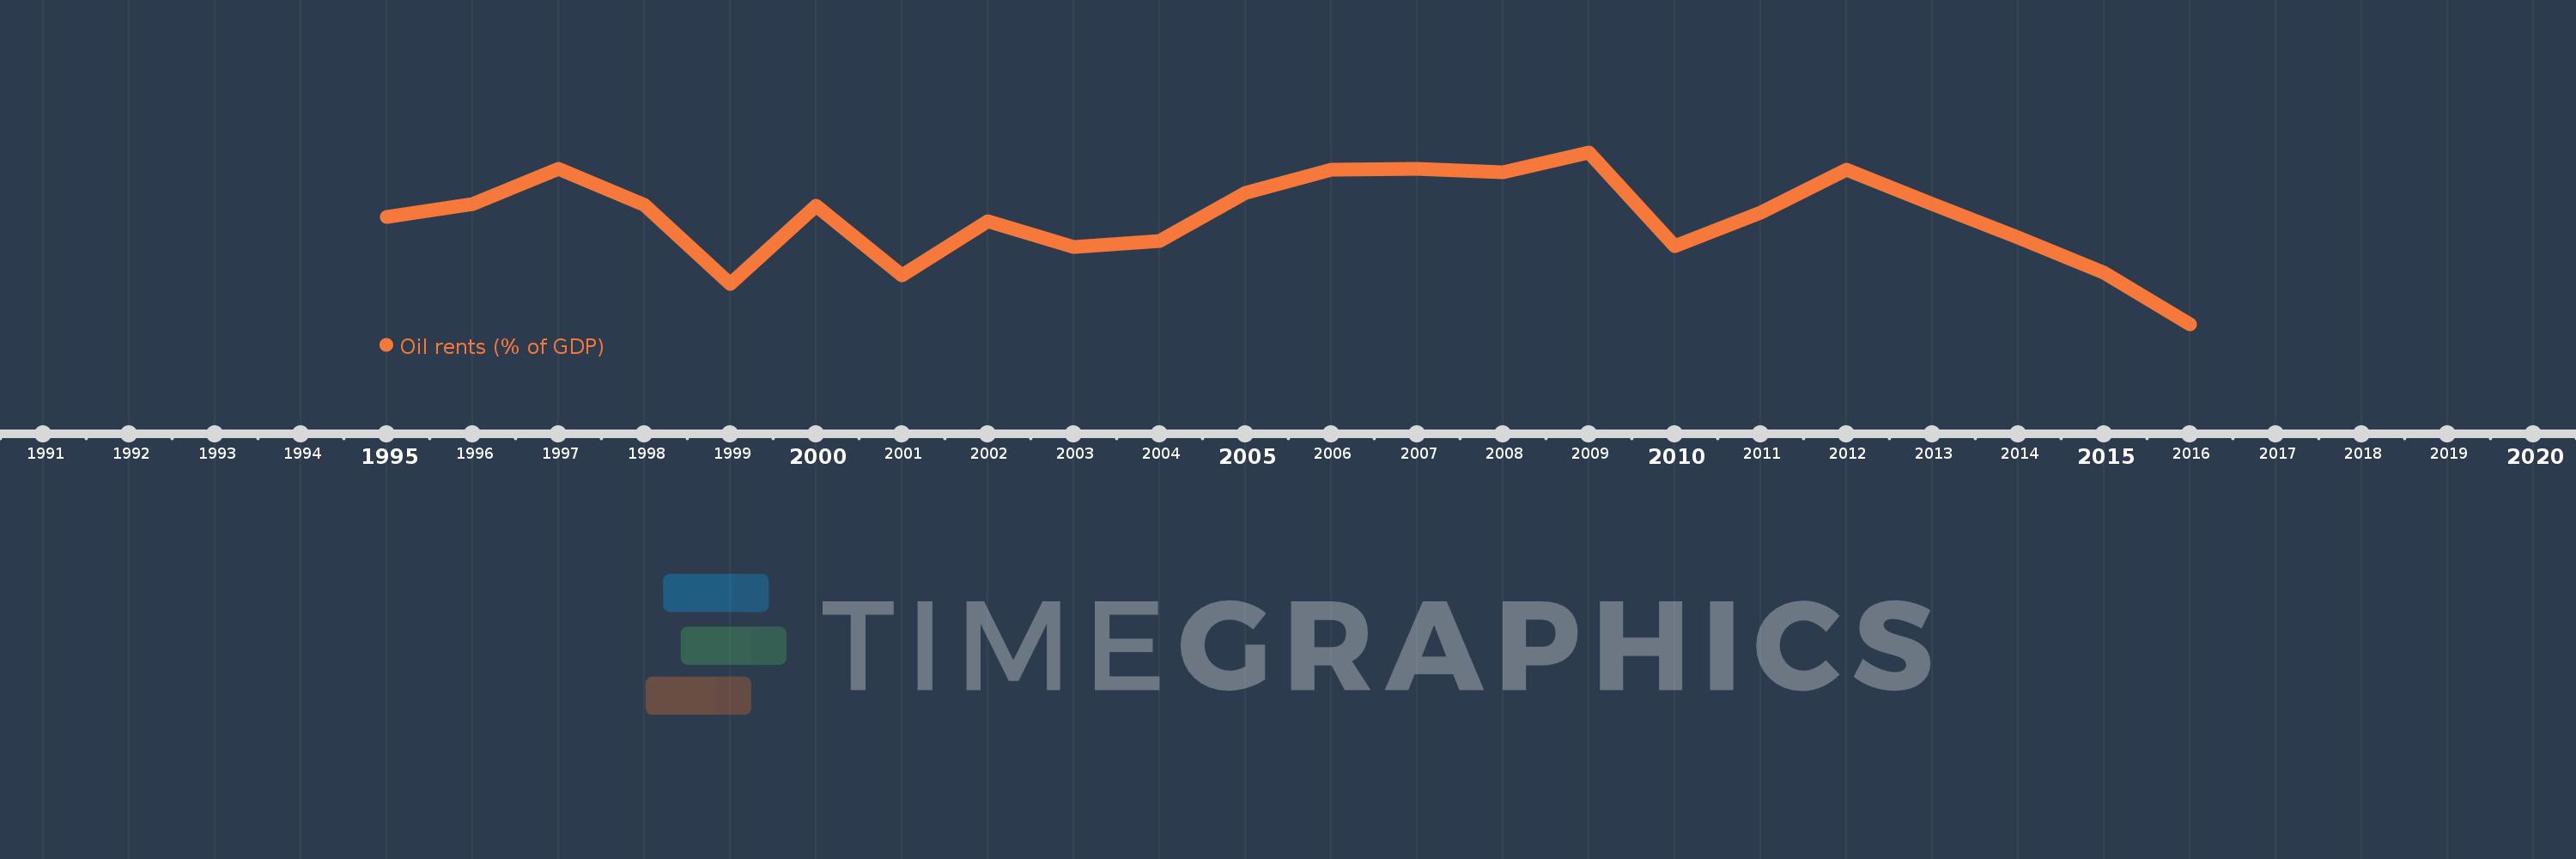
Questa scala temporale mostra un grafico dal 1995 anno al 2016 anno. Congo, Dem. Rep.. I dati fino ad 1994 anno non disponibili. Il numero di osservazioni attuali secondo i date: 22.
La fonte (nome):
Indicatori dello sviluppo mondiale
La fonte (organizzazione):
Estimates based on sources and methods described in "The Changing Wealth of Nations: Measuring Sustainable Development in the New Millennium" (World Bank, 2011).
Categorie:
Energy & Mining, Environment
sono stati aggiornati
23 apr 2017 anni
Indicatori delle variazioni dei valori per anni
In media:
1.827
Minima:
0.255
1 gen 2016 anni
Massimo:
2.793
1 gen 2009 anni
Alla data di osservazione
Valore
Variazione assoluta
La variazione rispetto al valore precedente
1 gen 1995 anni
1.846
+1.846
0.0%
1 gen 1996 anni
2.035
+0.188
10.18%
1 gen 1997 anni
2.556
+0.522
25.64%
1 gen 1998 anni
2.014
-0.542
-21.21%
1 gen 1999 anni
0.855
-1.16
-57.57%
1 gen 2000 anni
2.001
+1.147
134.19%
1 gen 2001 anni
0.972
-1.029
-51.42%
1 gen 2002 anni
1.778
+0.806
82.87%
1 gen 2003 anni
1.39
-0.388
-21.81%
1 gen 2004 anni
1.484
+0.094
6.77%
1 gen 2005 anni
2.194
+0.709
47.79%
1 gen 2006 anni
2.544
+0.351
16.0%
1 gen 2007 anni
2.547
+0.003
0.1%
1 gen 2008 anni
2.497
-0.05
-1.96%
1 gen 2009 anni
2.793
+0.296
11.84%
1 gen 2010 anni
1.41
-1.383
-49.5%
1 gen 2011 anni
1.899
+0.489
34.65%
1 gen 2012 anni
2.537
+0.638
33.6%
1 gen 2013 anni
2.035
-0.503
-19.81%
1 gen 2014 anni
1.537
-0.498
-24.46%
1 gen 2015 anni
1.011
-0.525
-34.19%
1 gen 2016 anni
0.255
-0.756
-74.76%
Classificazione dei paesi secondo i statistiche attuali per anni