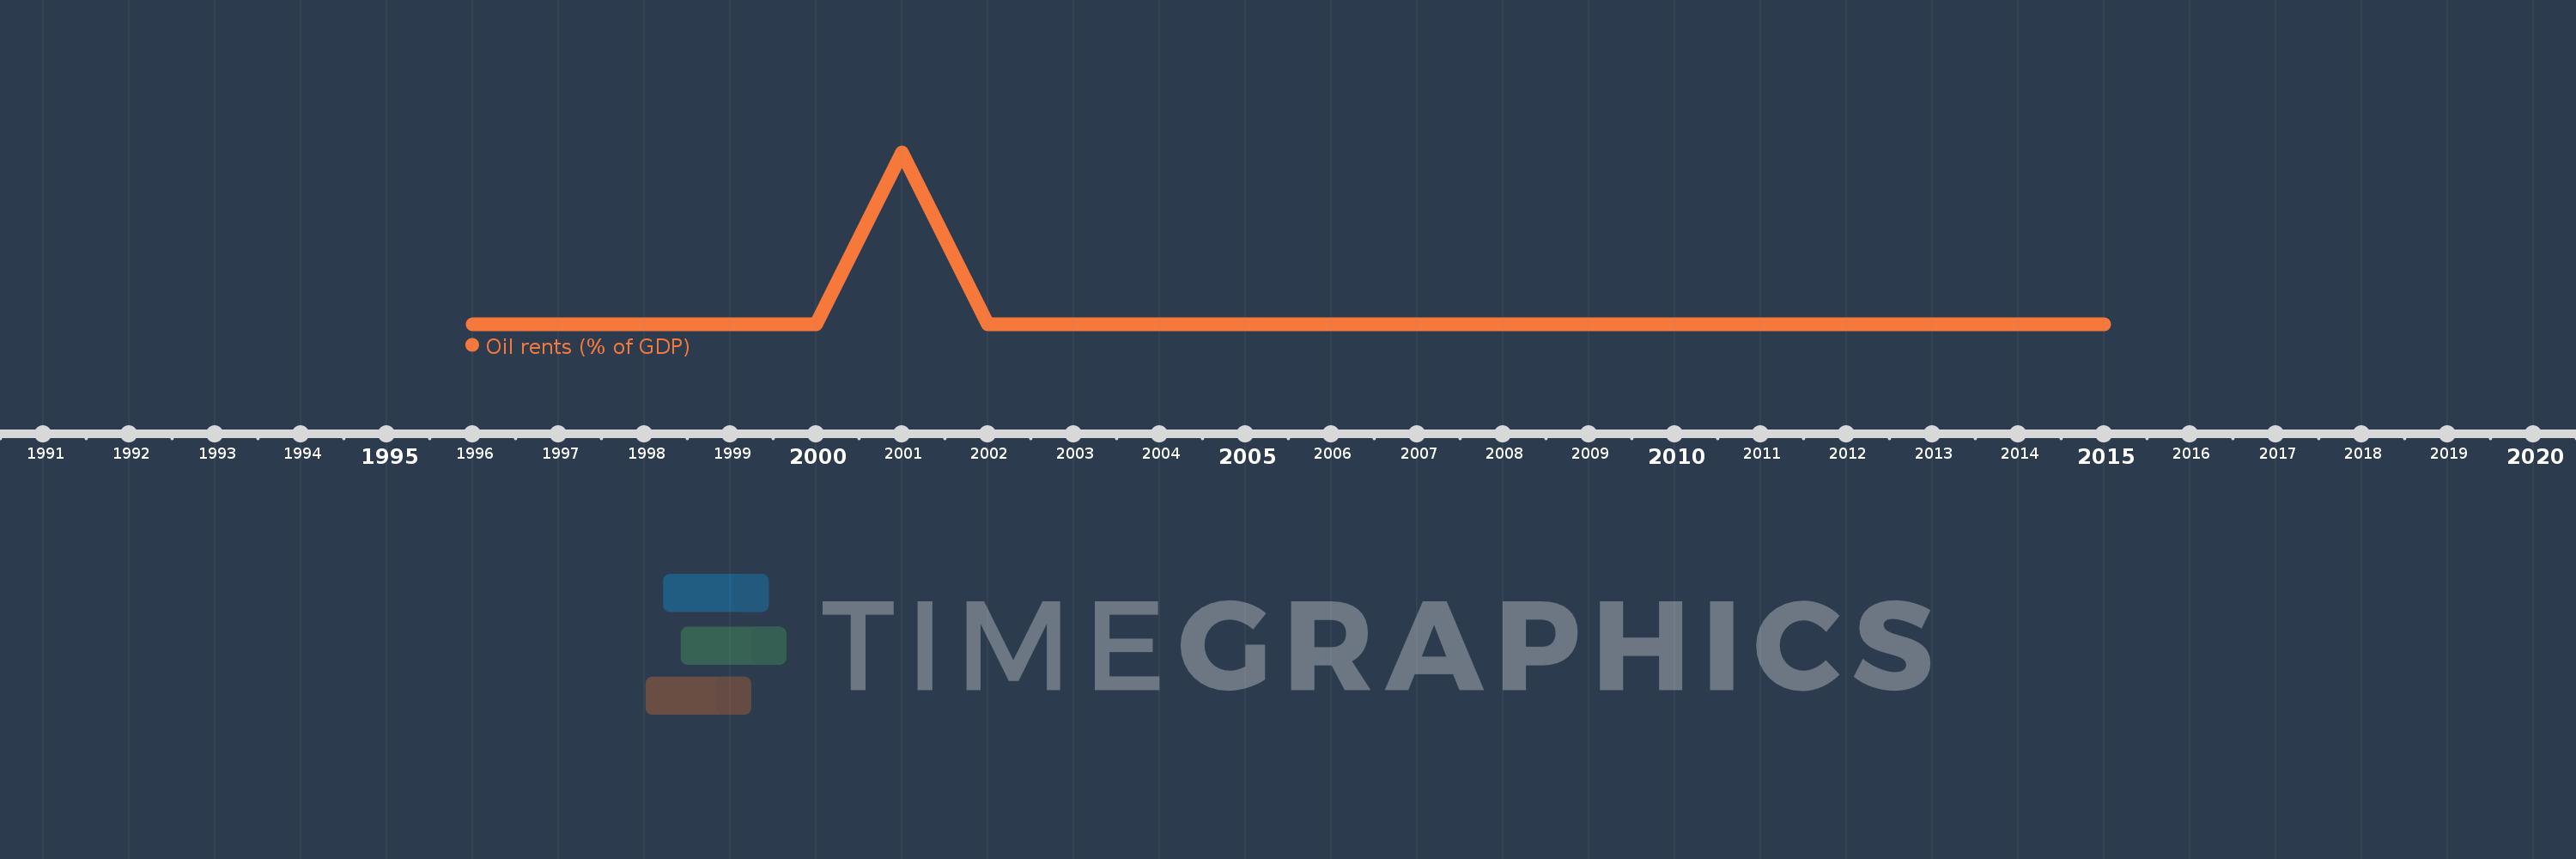
Questa scala temporale mostra un grafico dal 1996 anno al 2015 anno. Slovenia. I dati fino ad 1995 anno non disponibili. Il numero di osservazioni attuali secondo i date: 20.
La fonte (nome):
Indicatori dello sviluppo mondiale
La fonte (organizzazione):
Estimates based on sources and methods described in "The Changing Wealth of Nations: Measuring Sustainable Development in the New Millennium" (World Bank, 2011).
Categorie:
Energy & Mining, Environment
sono stati aggiornati
23 apr 2017 anni
Indicatori delle variazioni dei valori per anni
In media:
0.0
Minima:
0.0
1 gen 1999 anni
Massimo:
0.001
1 gen 2001 anni
Alla data di osservazione
Valore
Variazione assoluta
La variazione rispetto al valore precedente
1 gen 1996 anni
0.0
+0.0
0.0%
1 gen 1997 anni
0.0
0.0
-31.22%
1 gen 1998 anni
0.0
+0.0
5.75%
1 gen 1999 anni
0.0
0.0
-84.66%
1 gen 2000 anni
0.0
+0.0
309.92%
1 gen 2001 anni
0.001
+0.0
161.87%
1 gen 2002 anni
0.0
0.0
-49.42%
1 gen 2003 anni
0.0
0.0
-5.4%
1 gen 2004 anni
0.0
0.0
-31.87%
1 gen 2005 anni
0.0
0.0
-28.98%
1 gen 2006 anni
0.0
+0.0
20.16%
1 gen 2007 anni
0.0
+0.0
9.14%
1 gen 2008 anni
0.0
0.0
-13.11%
1 gen 2009 anni
0.0
+0.0
19.58%
1 gen 2010 anni
0.0
0.0
-42.0%
1 gen 2011 anni
0.0
+0.0
52.32%
1 gen 2012 anni
0.0
+0.0
43.0%
1 gen 2013 anni
0.0
+0.0
5.94%
1 gen 2014 anni
0.0
0.0
-10.56%
1 gen 2015 anni
0.0
0.0
-15.26%
Classificazione dei paesi secondo i statistiche attuali per anni