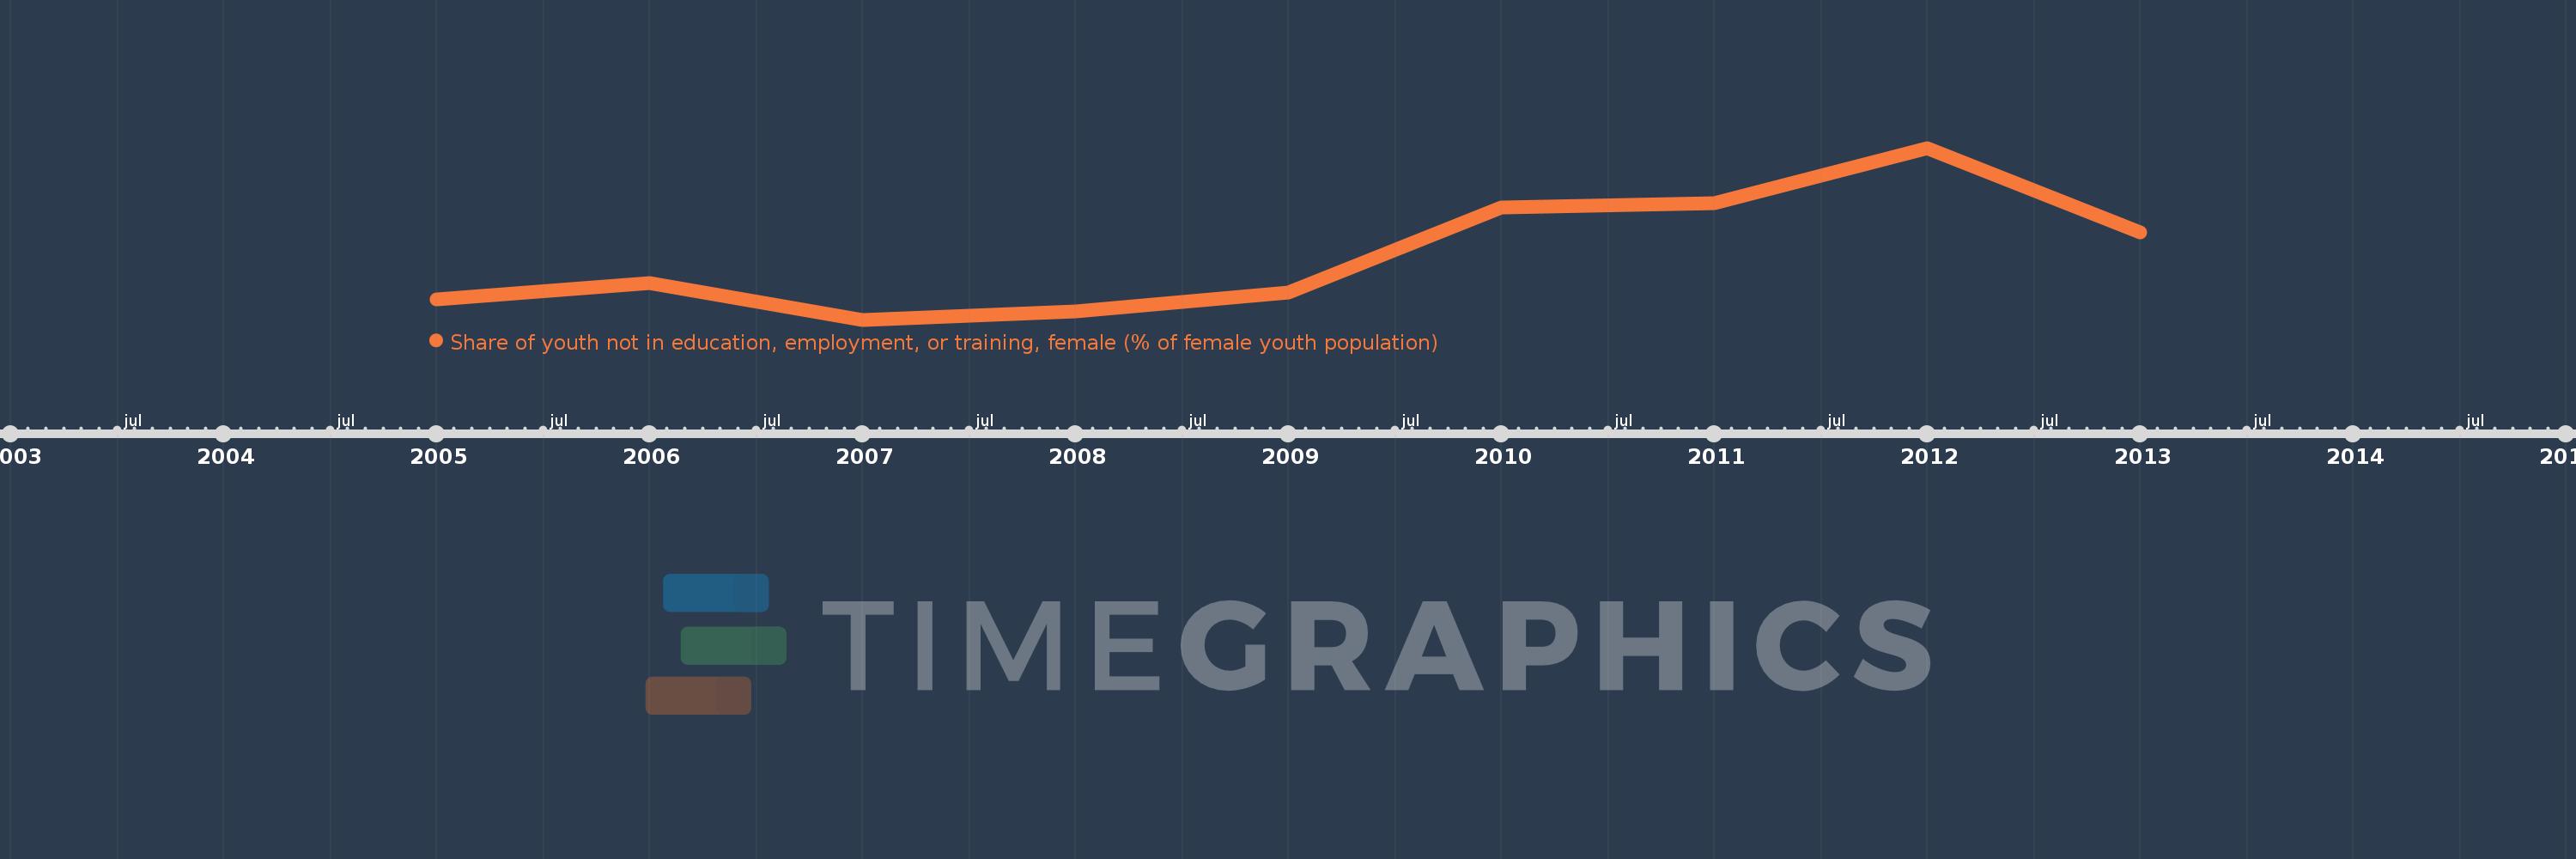
Questa scala temporale mostra un grafico dal 2005 anno al 2013 anno. Post-demographic dividend. I dati fino ad 2004 anno non disponibili. Il numero di osservazioni attuali secondo i date: 9.
La fonte (nome):
Indicatori dello sviluppo mondiale
La fonte (organizzazione):
International Labour Organization, Key Indicators of the Labour Market database.
Categorie:
Social Protection & Labor
sono stati aggiornati
23 apr 2017 anni
Indicatori delle variazioni dei valori per anni
In media:
13.285
Minima:
12.14
1 gen 2007 anni
Massimo:
15.19
1 gen 2012 anni
Alla data di osservazione
Valore
Variazione assoluta
La variazione rispetto al valore precedente
1 gen 2005 anni
12.507
+12.507
0.0%
1 gen 2006 anni
12.789
+0.282
2.25%
1 gen 2007 anni
12.14
-0.649
-5.07%
1 gen 2008 anni
12.293
+0.152
1.26%
1 gen 2009 anni
12.616
+0.324
2.63%
1 gen 2010 anni
14.132
+1.516
12.02%
1 gen 2011 anni
14.211
+0.078
0.55%
1 gen 2012 anni
15.19
+0.98
6.89%
1 gen 2013 anni
13.687
-1.504
-9.9%
Classificazione dei paesi secondo i statistiche attuali per anni