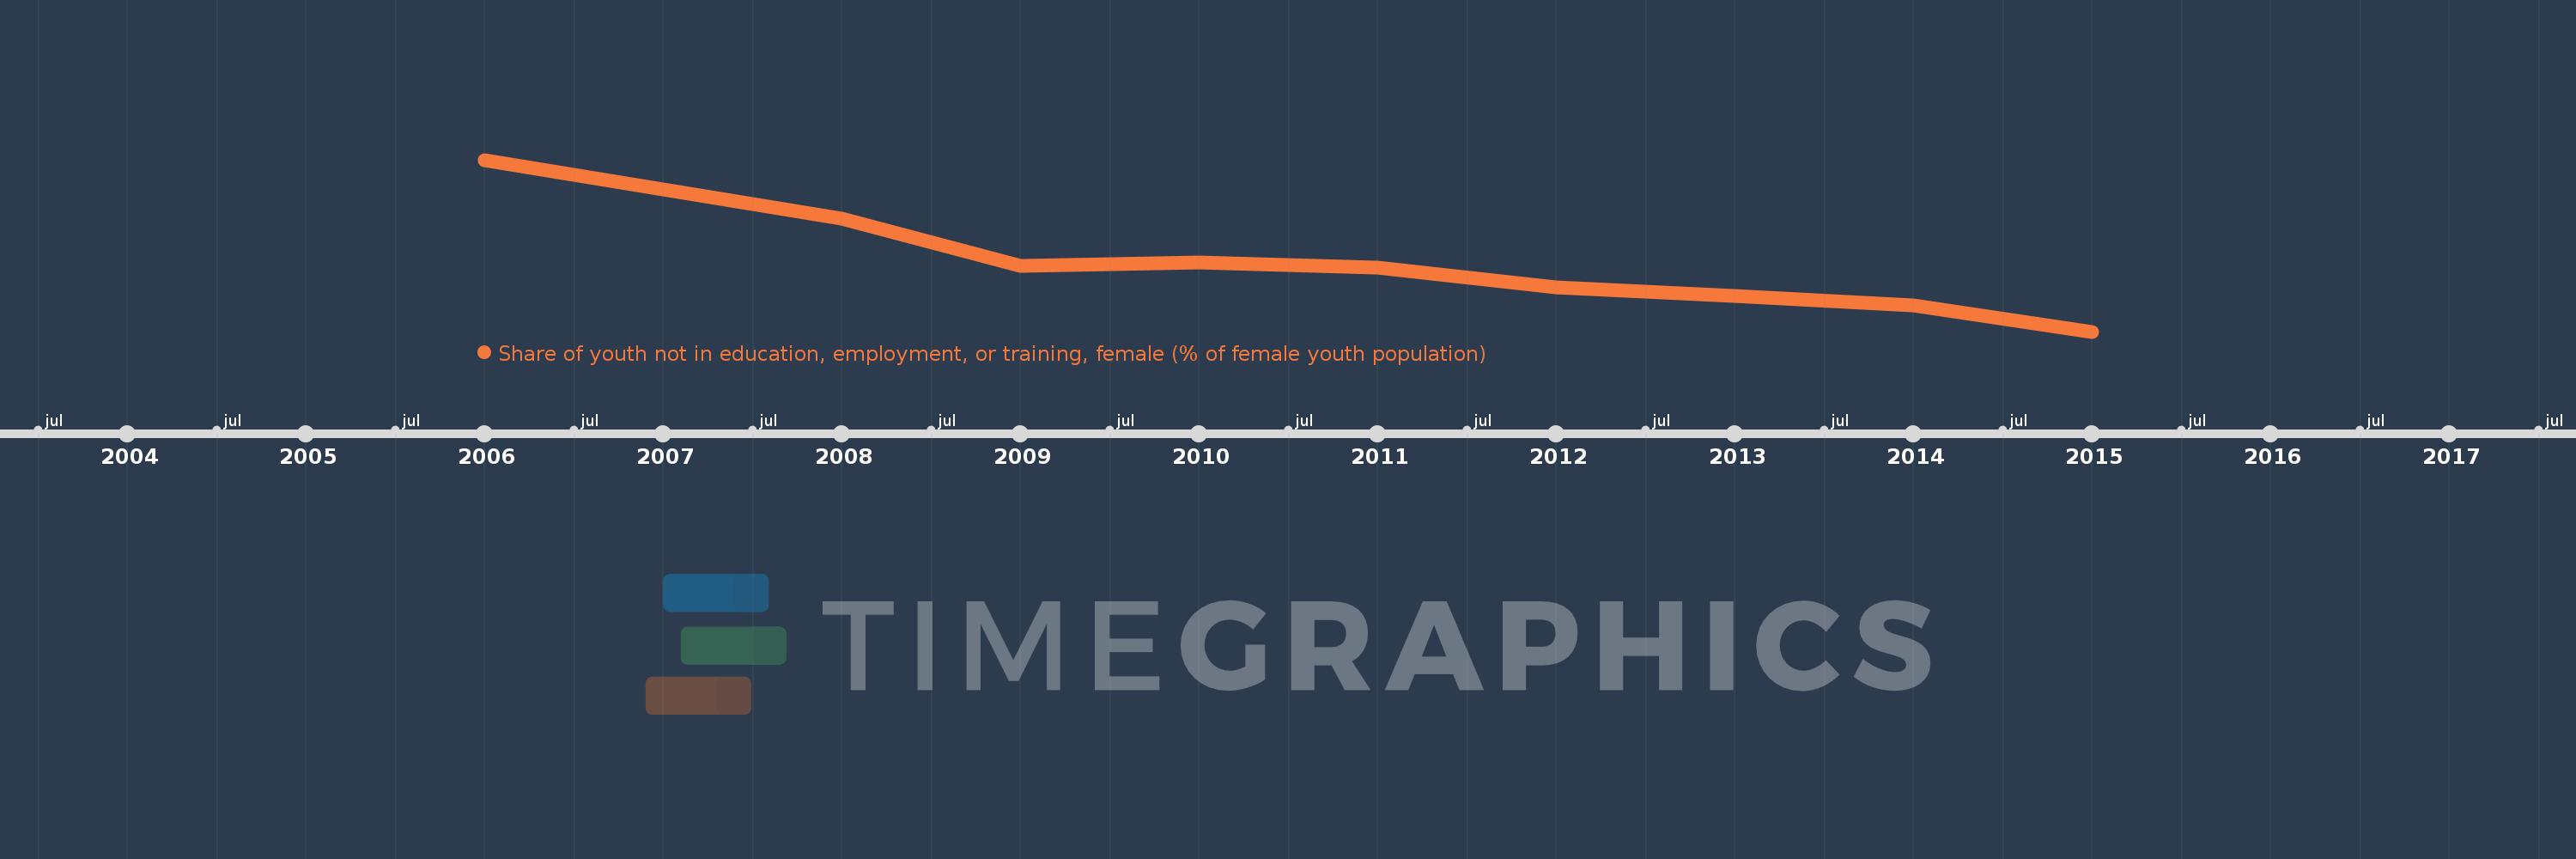
Questa scala temporale mostra un grafico dal 2006 anno al 2015 anno. Europe & Central Asia. I dati fino ad 2005 anno non disponibili. Il numero di osservazioni attuali secondo i date: 9.
La fonte (nome):
Indicatori dello sviluppo mondiale
La fonte (organizzazione):
International Labour Organization, Key Indicators of the Labour Market database.
Categorie:
Social Protection & Labor
sono stati aggiornati
23 apr 2017 anni
Indicatori delle variazioni dei valori per anni
In media:
18.429
Minima:
16.947
1 gen 2015 anni
Massimo:
20.832
1 gen 2006 anni
Alla data di osservazione
Valore
Variazione assoluta
La variazione rispetto al valore precedente
1 gen 2006 anni
20.832
+20.832
0.0%
1 gen 2008 anni
19.492
-1.34
-6.43%
1 gen 2009 anni
18.435
-1.057
-5.42%
1 gen 2010 anni
18.507
+0.072
0.39%
1 gen 2011 anni
18.403
-0.105
-0.57%
1 gen 2012 anni
17.942
-0.461
-2.5%
1 gen 2013 anni
17.75
-0.192
-1.07%
1 gen 2014 anni
17.549
-0.2
-1.13%
1 gen 2015 anni
16.947
-0.603
-3.43%
Classificazione dei paesi secondo i statistiche attuali per anni