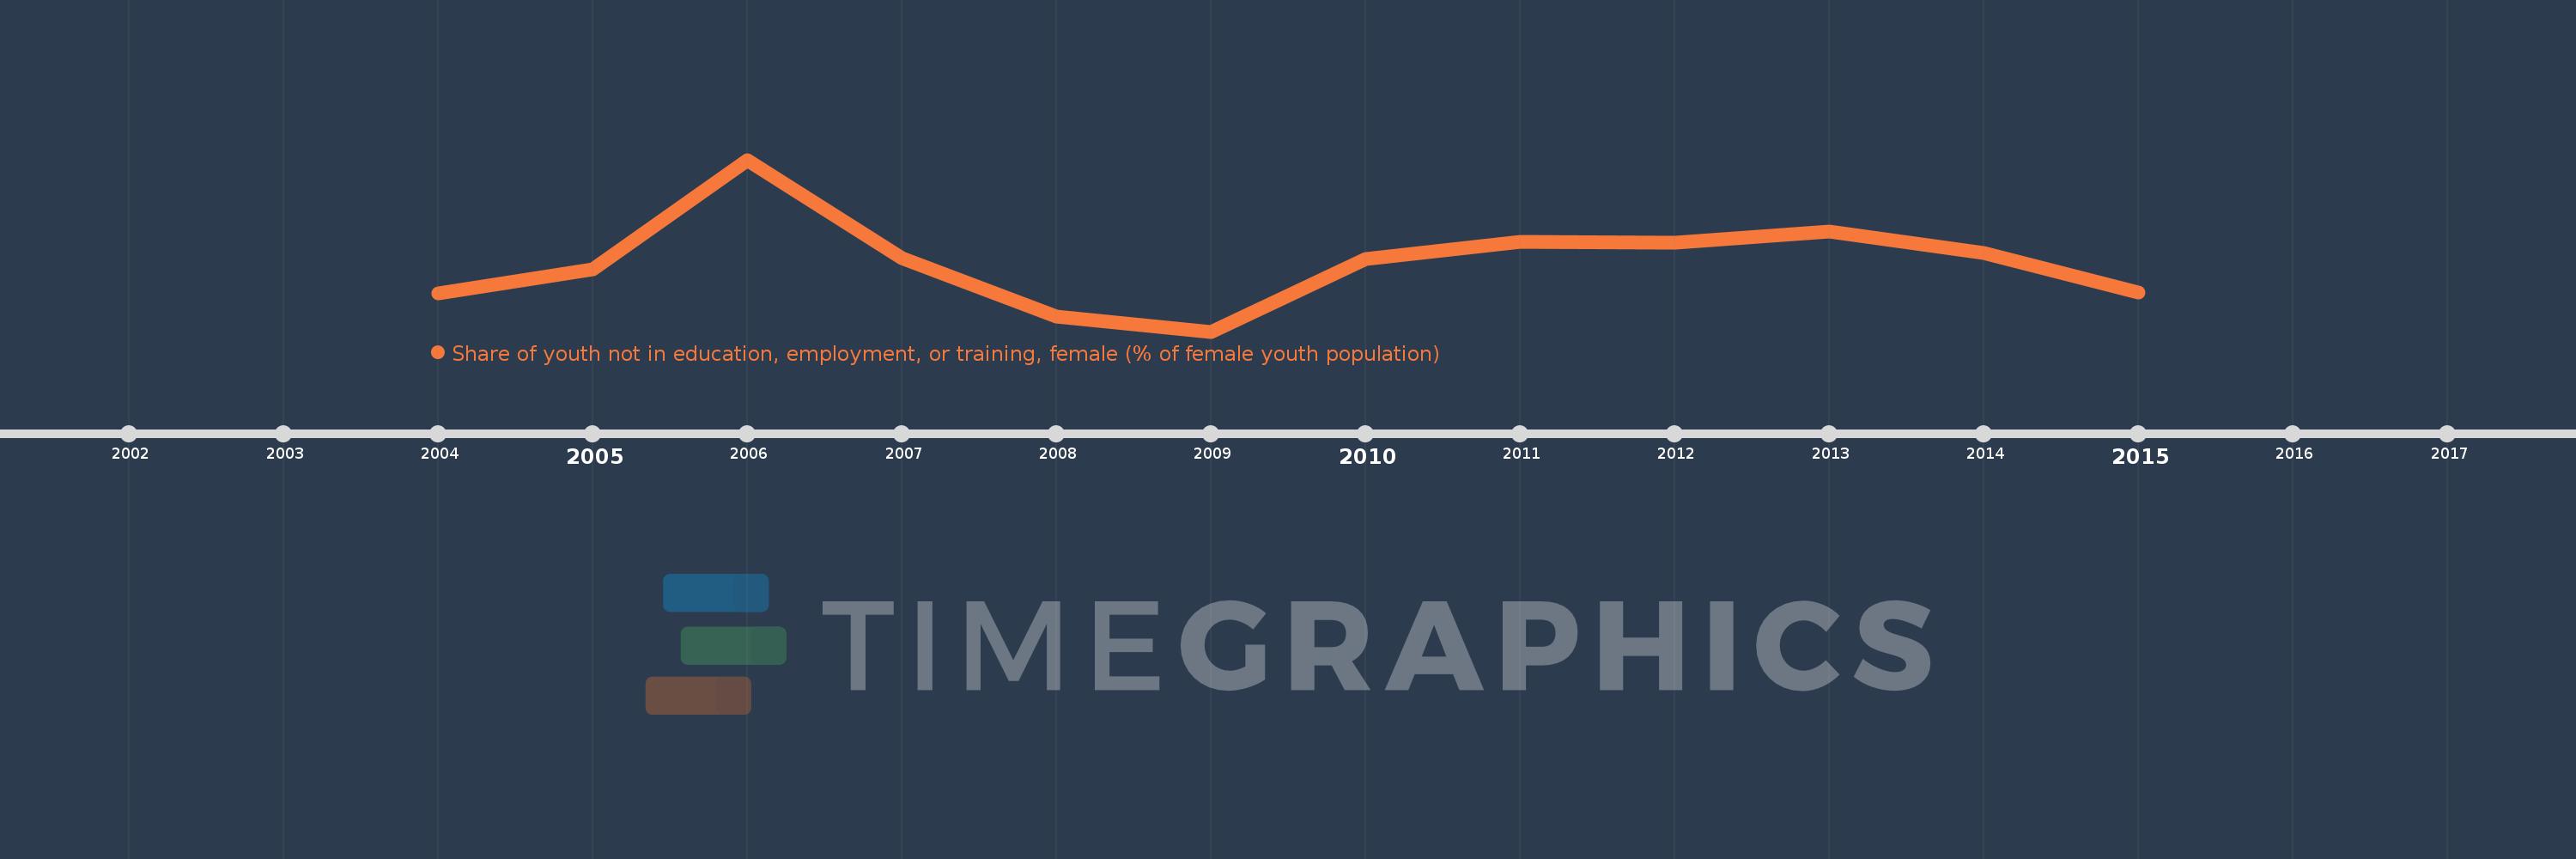
Questa scala temporale mostra un grafico dal 2004 anno al 2015 anno. Euro area. I dati fino ad 2003 anno non disponibili. Il numero di osservazioni attuali secondo i date: 12.
La fonte (nome):
Indicatori dello sviluppo mondiale
La fonte (organizzazione):
International Labour Organization, Key Indicators of the Labour Market database.
Categorie:
Social Protection & Labor
sono stati aggiornati
23 apr 2017 anni
Indicatori delle variazioni dei valori per anni
In media:
12.549
Minima:
11.779
1 gen 2009 anni
Massimo:
13.695
1 gen 2006 anni
Alla data di osservazione
Valore
Variazione assoluta
La variazione rispetto al valore precedente
1 gen 2004 anni
12.204
+12.204
0.0%
1 gen 2005 anni
12.47
+0.266
2.18%
1 gen 2006 anni
13.695
+1.224
9.82%
1 gen 2007 anni
12.594
-1.1
-8.03%
1 gen 2008 anni
11.942
-0.652
-5.18%
1 gen 2009 anni
11.779
-0.163
-1.37%
1 gen 2010 anni
12.586
+0.807
6.85%
1 gen 2011 anni
12.776
+0.19
1.51%
1 gen 2012 anni
12.77
-0.005
-0.04%
1 gen 2013 anni
12.895
+0.125
0.98%
1 gen 2014 anni
12.659
-0.236
-1.83%
1 gen 2015 anni
12.216
-0.443
-3.5%
Classificazione dei paesi secondo i statistiche attuali per anni