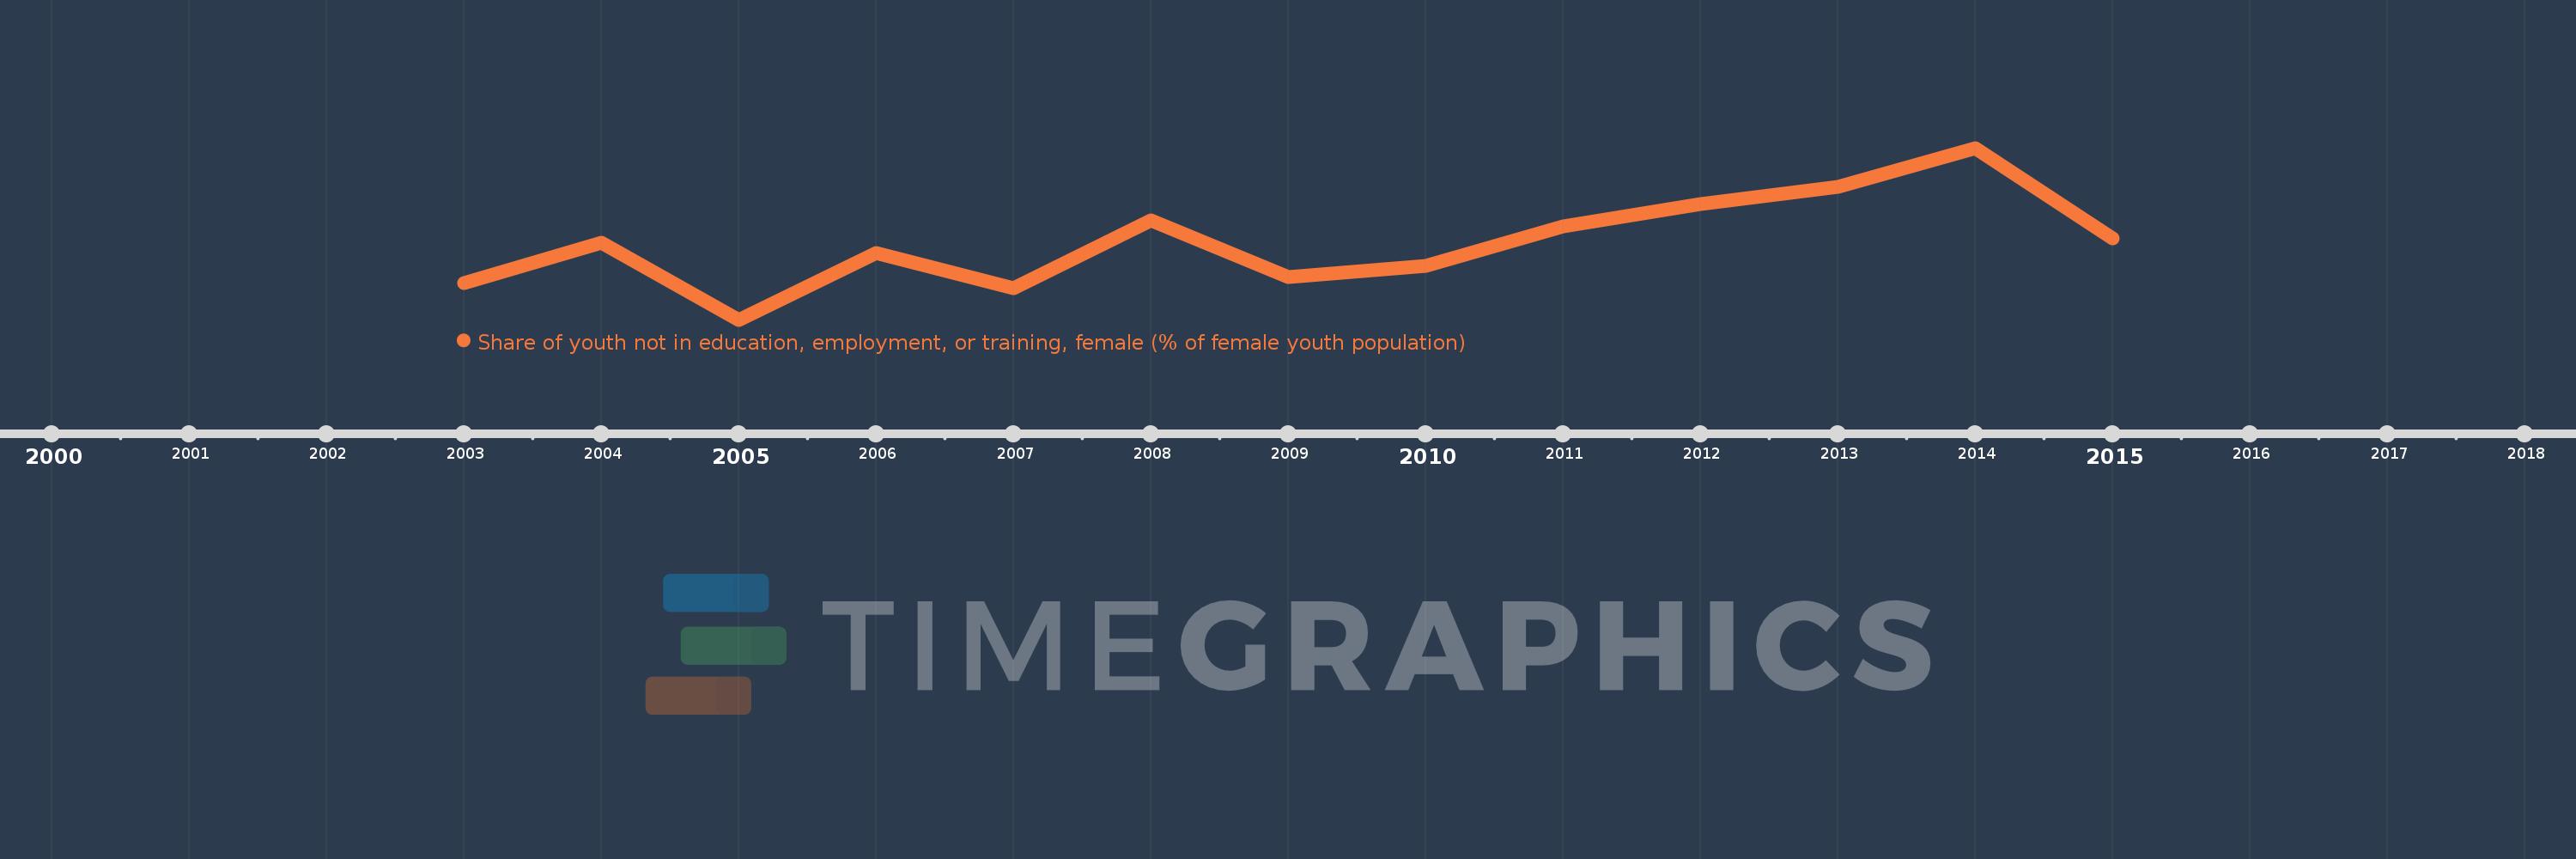
Questa scala temporale mostra un grafico dal 2003 anno al 2015 anno. Portugal. I dati fino ad 2002 anno non disponibili. Il numero di osservazioni attuali secondo i date: 13.
La fonte (nome):
Indicatori dello sviluppo mondiale
La fonte (organizzazione):
International Labour Organization, Key Indicators of the Labour Market database.
Categorie:
Social Protection & Labor
sono stati aggiornati
23 apr 2017 anni
Indicatori delle variazioni dei valori per anni
In media:
12.209
Minima:
10.8
1 gen 2005 anni
Massimo:
13.94
1 gen 2014 anni
Alla data di osservazione
Valore
Variazione assoluta
La variazione rispetto al valore precedente
1 gen 2003 anni
11.47
+11.47
0.0%
1 gen 2004 anni
12.21
+0.74
6.45%
1 gen 2005 anni
10.8
-1.41
-11.55%
1 gen 2006 anni
12.02
+1.22
11.3%
1 gen 2007 anni
11.38
-0.64
-5.32%
1 gen 2008 anni
12.61
+1.23
10.81%
1 gen 2009 anni
11.58
-1.03
-8.17%
1 gen 2010 anni
11.78
+0.2
1.73%
1 gen 2011 anni
12.5
+0.72
6.11%
1 gen 2012 anni
12.92
+0.42
3.36%
1 gen 2013 anni
13.23
+0.31
2.4%
1 gen 2014 anni
13.94
+0.71
5.37%
1 gen 2015 anni
12.28
-1.66
-11.91%
Classificazione dei paesi secondo i statistiche attuali per anni