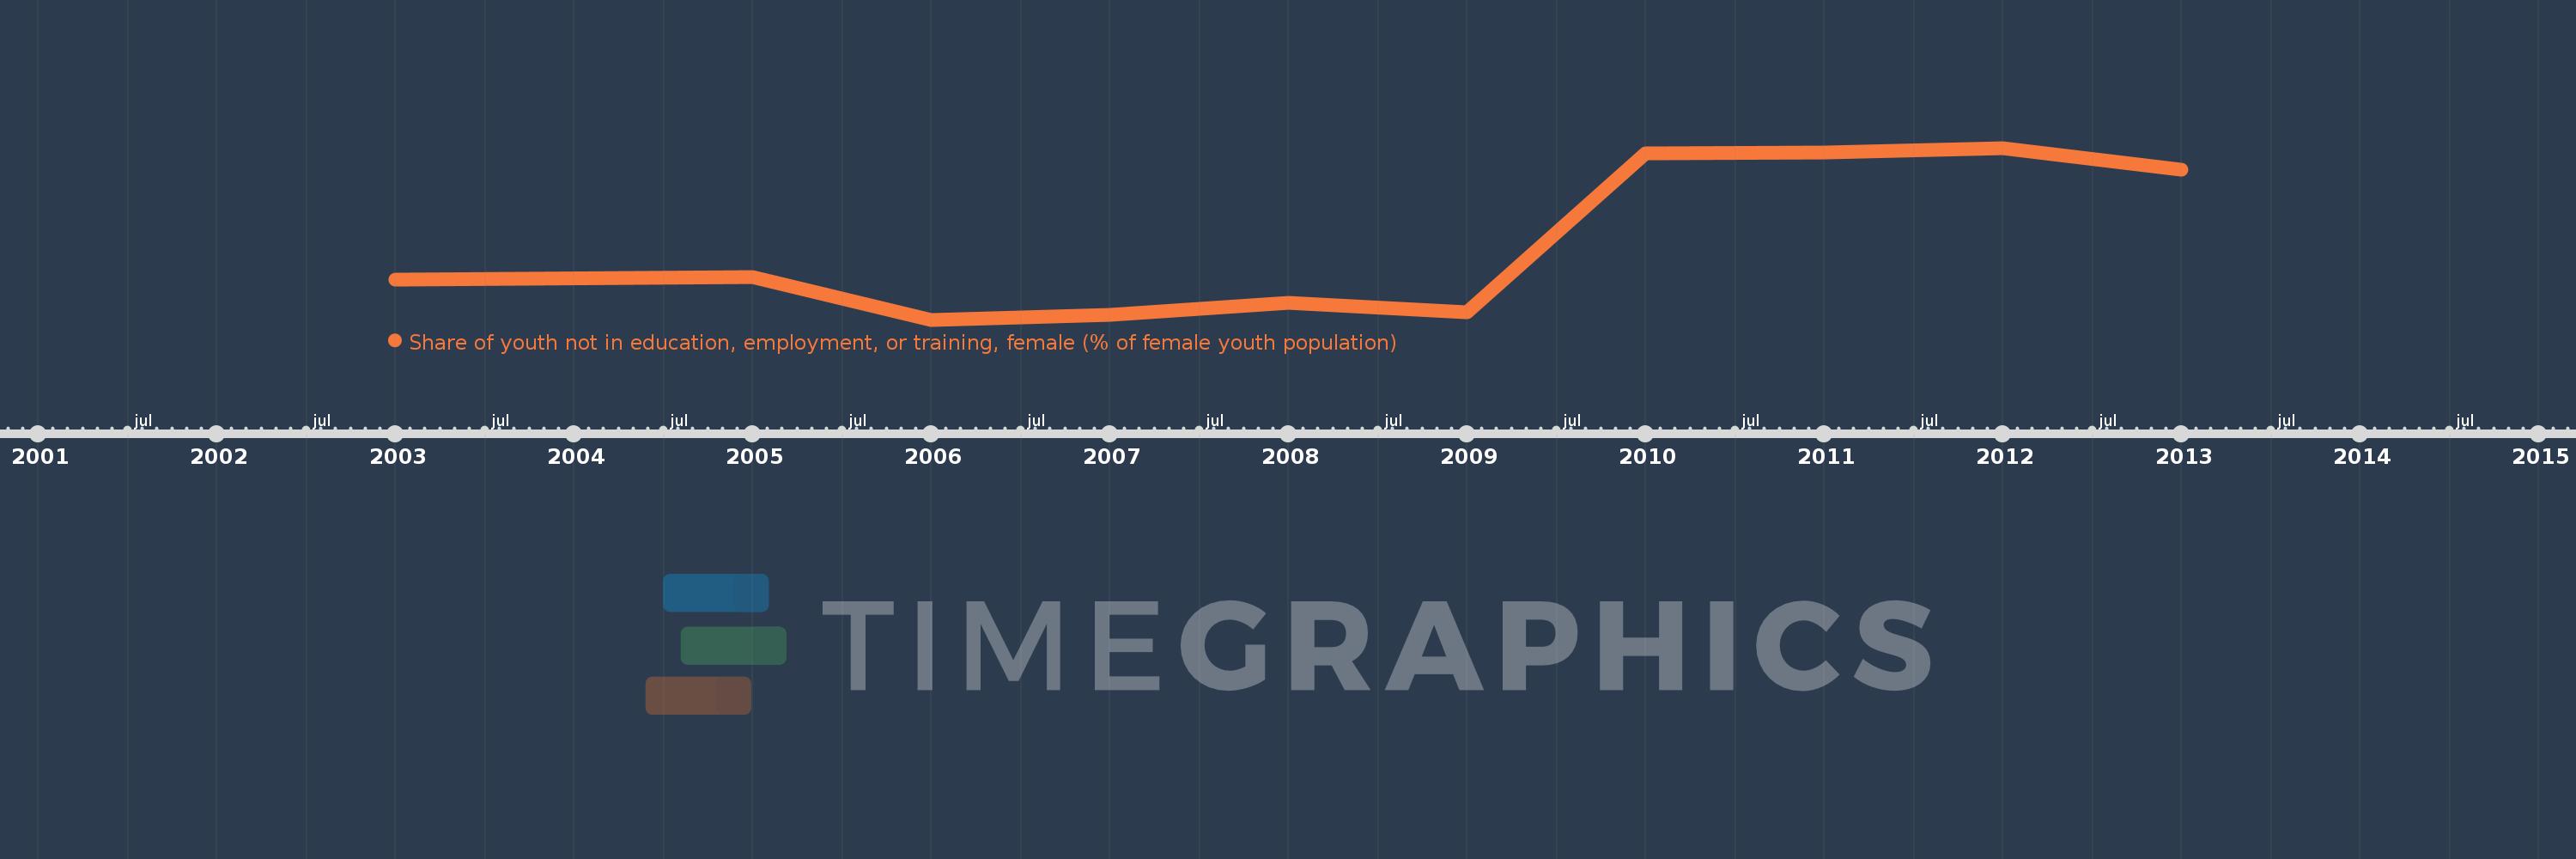
Questa scala temporale mostra un grafico dal 2003 anno al 2013 anno. North America. I dati fino ad 2002 anno non disponibili. Il numero di osservazioni attuali secondo i date: 10.
La fonte (nome):
Indicatori dello sviluppo mondiale
La fonte (organizzazione):
International Labour Organization, Key Indicators of the Labour Market database.
Categorie:
Social Protection & Labor
sono stati aggiornati
23 apr 2017 anni
Indicatori delle variazioni dei valori per anni
In media:
14.704
Minima:
12.333
1 gen 2006 anni
Massimo:
17.641
1 gen 2012 anni
Alla data di osservazione
Valore
Variazione assoluta
La variazione rispetto al valore precedente
1 gen 2003 anni
13.58
+13.58
0.0%
1 gen 2005 anni
13.644
+0.063
0.47%
1 gen 2006 anni
12.333
-1.31
-9.6%
1 gen 2007 anni
12.476
+0.143
1.16%
1 gen 2008 anni
12.852
+0.376
3.01%
1 gen 2009 anni
12.559
-0.293
-2.28%
1 gen 2010 anni
17.481
+4.922
39.19%
1 gen 2011 anni
17.504
+0.023
0.13%
1 gen 2012 anni
17.641
+0.137
0.78%
1 gen 2013 anni
16.975
-0.666
-3.78%
Classificazione dei paesi secondo i statistiche attuali per anni