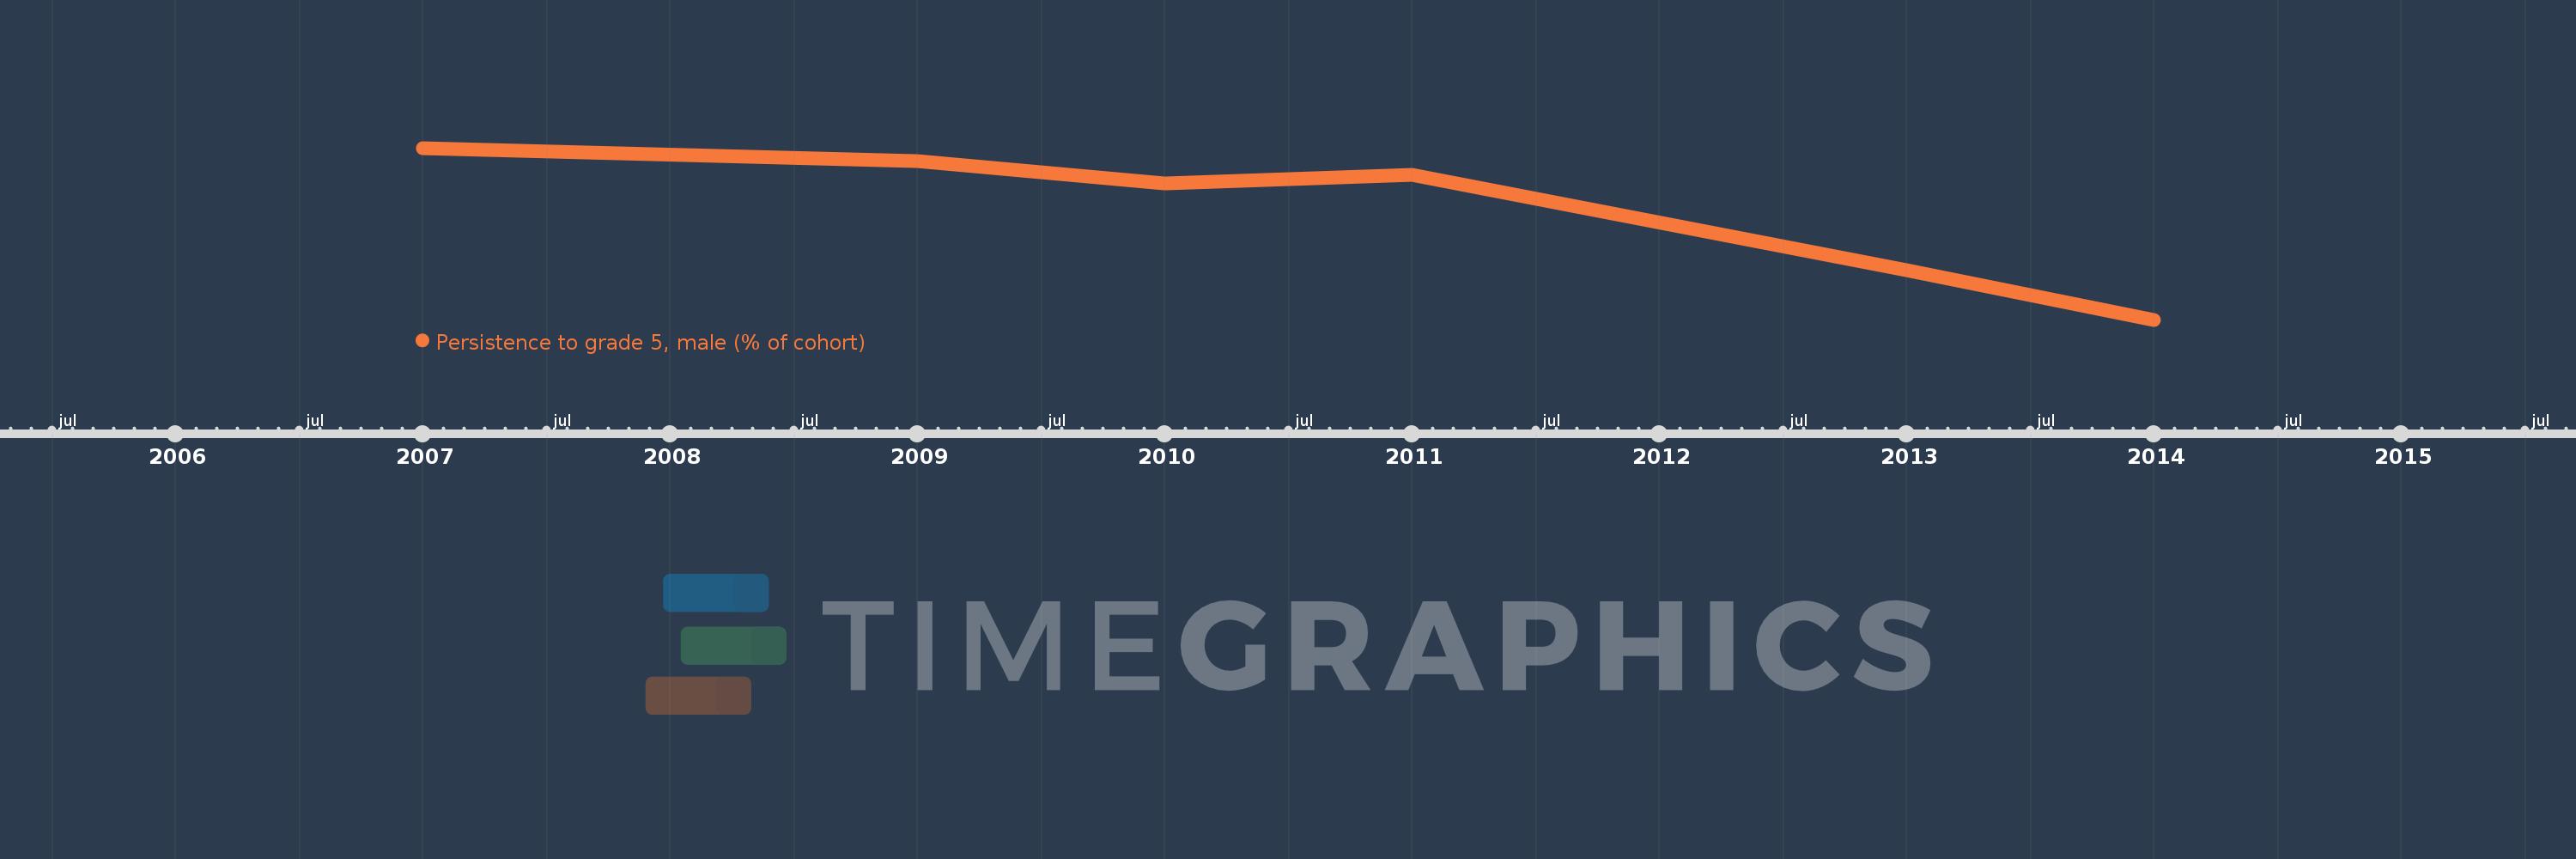
Questa scala temporale mostra un grafico dal 2007 anno al 2014 anno. Late-demographic dividend. I dati fino ad 2006 anno non disponibili. Il numero di osservazioni attuali secondo i date: 6.
La fonte (nome):
Indicatori dello sviluppo mondiale
La fonte (organizzazione):
United Nations Educational, Scientific, and Cultural Organization (UNESCO) Institute for Statistics.
Categorie:
Education, Gender
sono stati aggiornati
23 apr 2017 anni
Indicatori delle variazioni dei valori per anni
In media:
93.016
Minima:
83.335
1 gen 2014 anni
Massimo:
98.42
1 gen 2007 anni
Alla data di osservazione
Valore
Variazione assoluta
La variazione rispetto al valore precedente
1 gen 2007 anni
98.42
+98.42
0.0%
1 gen 2009 anni
97.292
-1.128
-1.15%
1 gen 2010 anni
95.322
-1.97
-2.02%
1 gen 2011 anni
96.061
+0.738
0.77%
1 gen 2013 anni
87.668
-8.392
-8.74%
1 gen 2014 anni
83.335
-4.333
-4.94%
Classificazione dei paesi secondo i statistiche attuali per anni