33
/it/
AIzaSyB4mHJ5NPEv-XzF7P6NDYXjlkCWaeKw5bc
November 30, 2025
258776
Syrian Arab Republic
SYR
true
2
1
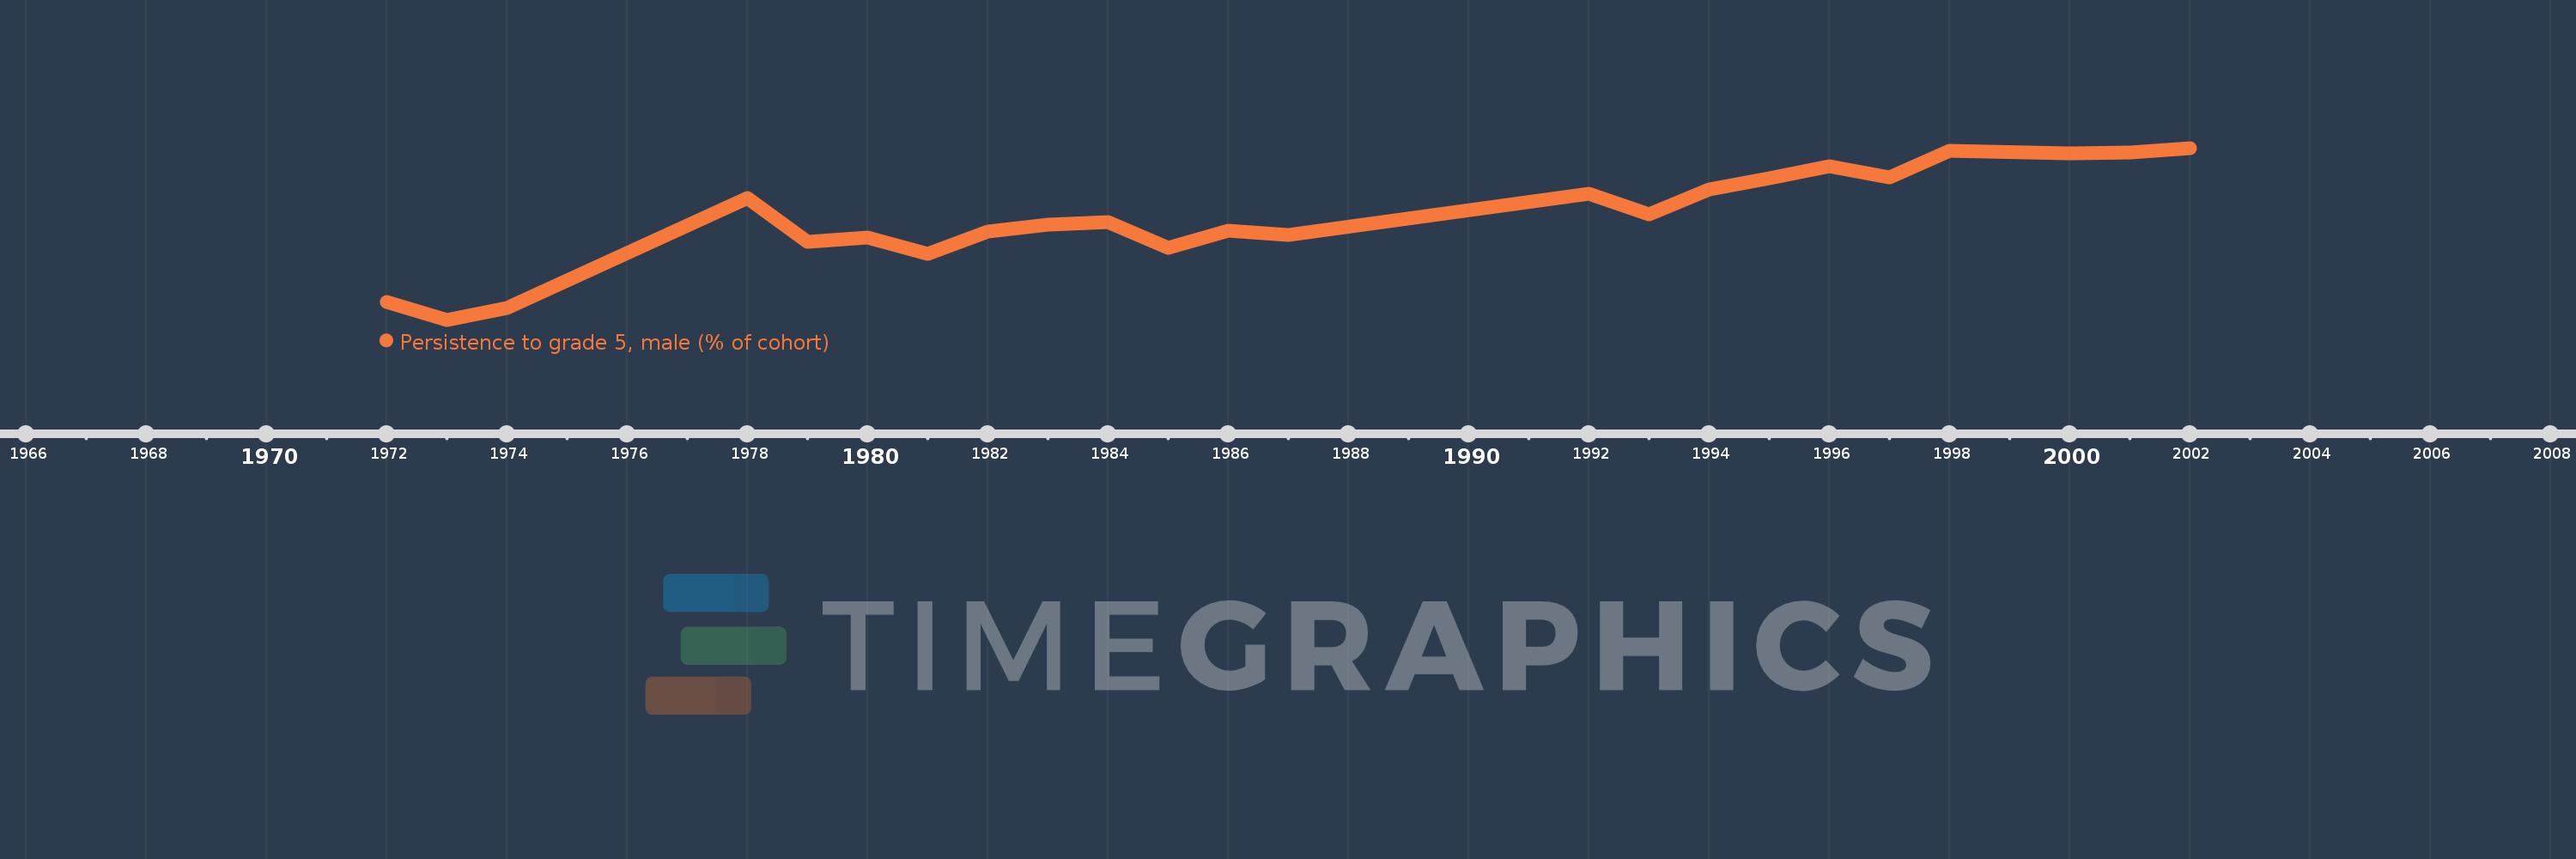
Persistence to grade 5, male (% of cohort)
2002,2001,2000,1998,1997,1996,1995,1994,1993,1992,1987,1986,1985,1984,1983,1982,1981,1980,1979,1978,1977,1974,1973,1972