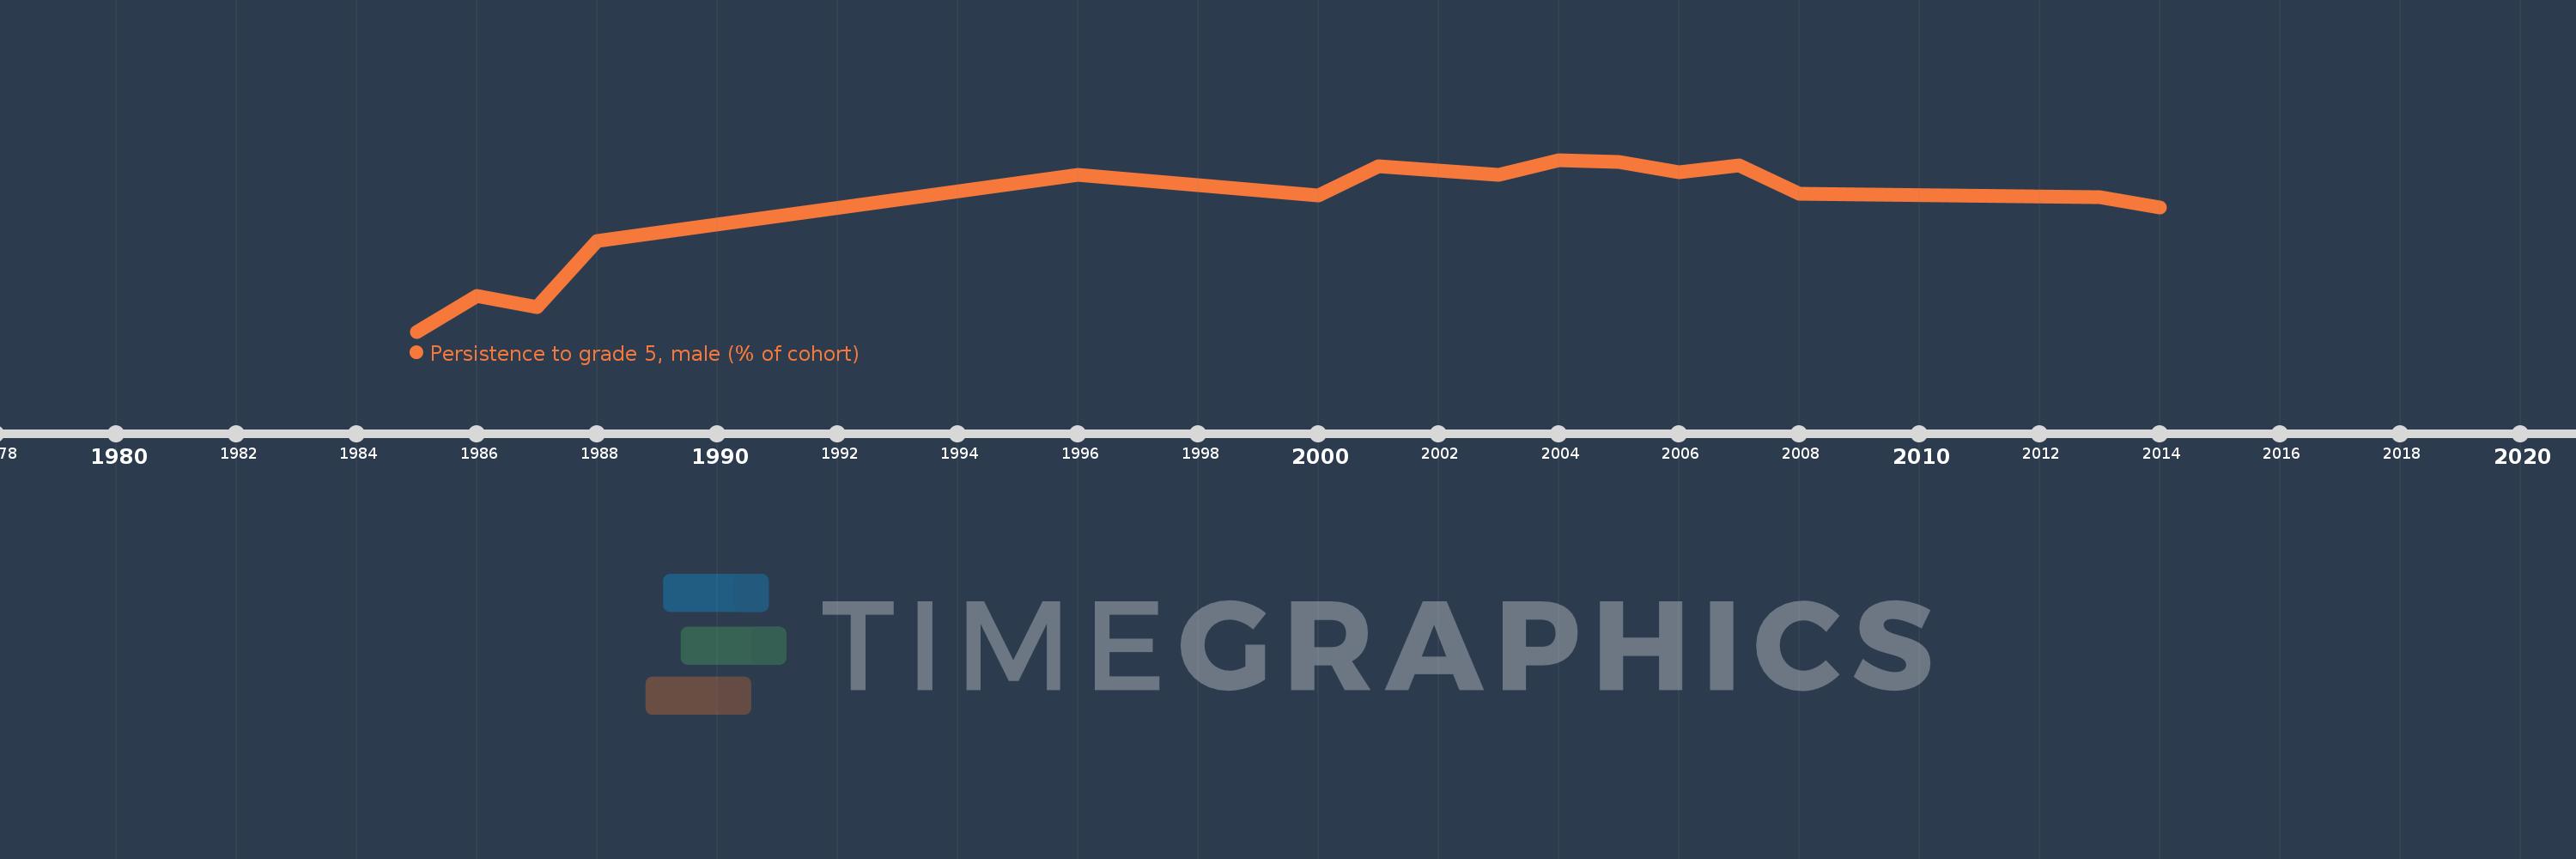
Questa scala temporale mostra un grafico dal 1985 anno al 2014 anno. Cyprus. I dati fino ad 1984 anno non disponibili. Il numero di osservazioni attuali secondo i date: 16.
La fonte (nome):
Indicatori dello sviluppo mondiale
La fonte (organizzazione):
United Nations Educational, Scientific, and Cultural Organization (UNESCO) Institute for Statistics.
Categorie:
Education, Gender
sono stati aggiornati
23 apr 2017 anni
Indicatori delle variazioni dei valori per anni
In media:
91.73
Minima:
70.115
1 gen 1985 anni
Massimo:
99.975
1 gen 2004 anni
Alla data di osservazione
Valore
Variazione assoluta
La variazione rispetto al valore precedente
1 gen 1985 anni
70.115
+70.115
0.0%
1 gen 1986 anni
76.265
+6.151
8.77%
1 gen 1987 anni
74.333
-1.933
-2.53%
1 gen 1988 anni
85.828
+11.495
15.46%
1 gen 1996 anni
97.412
+11.584
13.5%
1 gen 2000 anni
93.786
-3.626
-3.72%
1 gen 2001 anni
98.876
+5.09
5.43%
1 gen 2002 anni
98.133
-0.743
-0.75%
1 gen 2003 anni
97.321
-0.812
-0.83%
1 gen 2004 anni
99.975
+2.654
2.73%
1 gen 2005 anni
99.543
-0.432
-0.43%
1 gen 2006 anni
97.861
-1.682
-1.69%
1 gen 2007 anni
98.987
+1.126
1.15%
1 gen 2008 anni
94.067
-4.92
-4.97%
1 gen 2013 anni
93.465
-0.602
-0.64%
1 gen 2014 anni
91.715
-1.75
-1.87%
Classificazione dei paesi secondo i statistiche attuali per anni