29
/it/
it
AIzaSyAYiBZKx7MnpbEhh9jyipgxe19OcubqV5w
April 1, 2024
100380
Cameroon
CMR
true
2
1
Persistence to grade 5, male (% of cohort)
2012,2011,2010,2009,2008,2007,1992,1991,1989,1988,1987,1986,1985,1984,1983,1982,1981,1980,1979,1978,1977,1976,1975,1974
Download
Biblioteca di statistiche globali →Cameroon →

Persistence to grade 5, male (% of cohort)

Queste statistiche in altri paesi:
AfghanistanAlbaniaAlgeriaAndorraAngolaAntigua and BarbudaArab WorldArgentinaArubaBahamas, TheBahrainBangladeshBarbadosBelgiumBelizeBeninBermudaBhutanBoliviaBosnia and HerzegovinaBotswanaBrunei DarussalamBurkina FasoBurundiCabo VerdeCambodiaCameroonCanadaCaribbean small statesCayman IslandsCentral African RepublicChadChileChinaColombiaComorosCongo, Dem. Rep.Congo, Rep.Costa RicaCote d'IvoireCubaCyprusCzech RepublicDenmarkDjiboutiDominicaDominican RepublicEarly-demographic dividendEast Asia & PacificEast Asia & Pacific (excluding high income)East Asia & Pacific (IDA & IBRD countries)EcuadorEgypt, Arab Rep.El SalvadorEquatorial GuineaEritreaEstoniaEthiopiaFijiFinlandFranceGabonGambia, TheGeorgiaGhanaGreeceGrenadaGuatemalaGuineaGuinea-BissauGuyanaHaitiHeavily indebted poor countries (HIPC)HondurasHong Kong SAR, ChinaHungaryIcelandIDA blendIDA onlyIDA totalIndiaIndonesiaIran, Islamic Rep.IraqIrelandIsraelItalyJamaicaJapanJordanKenyaKiribatiKorea, Rep.KuwaitLao PDRLate-demographic dividendLatviaLeast developed countries: UN classificationLebanonLesothoLiberiaLibyaLiechtensteinLow incomeLower middle incomeLuxembourgMacao SAR, ChinaMadagascarMalawiMalaysiaMaldivesMaliMaltaMarshall IslandsMauritaniaMauritiusMexicoMiddle East & North AfricaMiddle East & North Africa (excluding high income)Middle East & North Africa (IDA & IBRD countries)MontenegroMoroccoMozambiqueMyanmarNamibiaNepalNetherlandsNicaraguaNigerNigeriaNorwayOmanOther small statesPacific island small statesPakistanPanamaPapua New GuineaParaguayPeruPhilippinesPolandPortugalPre-demographic dividendQatarRwandaSamoaSan MarinoSao Tome and PrincipeSaudi ArabiaSenegalSeychellesSierra LeoneSingaporeSloveniaSolomon IslandsSouth AfricaSouth AsiaSouth Asia (IDA & IBRD)SpainSri LankaSt. Kitts and NevisSt. LuciaSt. Vincent and the GrenadinesSub-Saharan Africa Sub-Saharan Africa (excluding high income)Sub-Saharan Africa (IDA & IBRD countries)SudanSurinameSwazilandSwedenSwitzerlandSyrian Arab RepublicTanzaniaThailandTimor-LesteTogoTongaTrinidad and TobagoTunisiaTurkeyUgandaUnited Arab EmiratesUpper middle incomeUruguayVanuatuVenezuela, RBVietnamYemen, Rep.ZambiaZimbabwe
Linea del tempo:
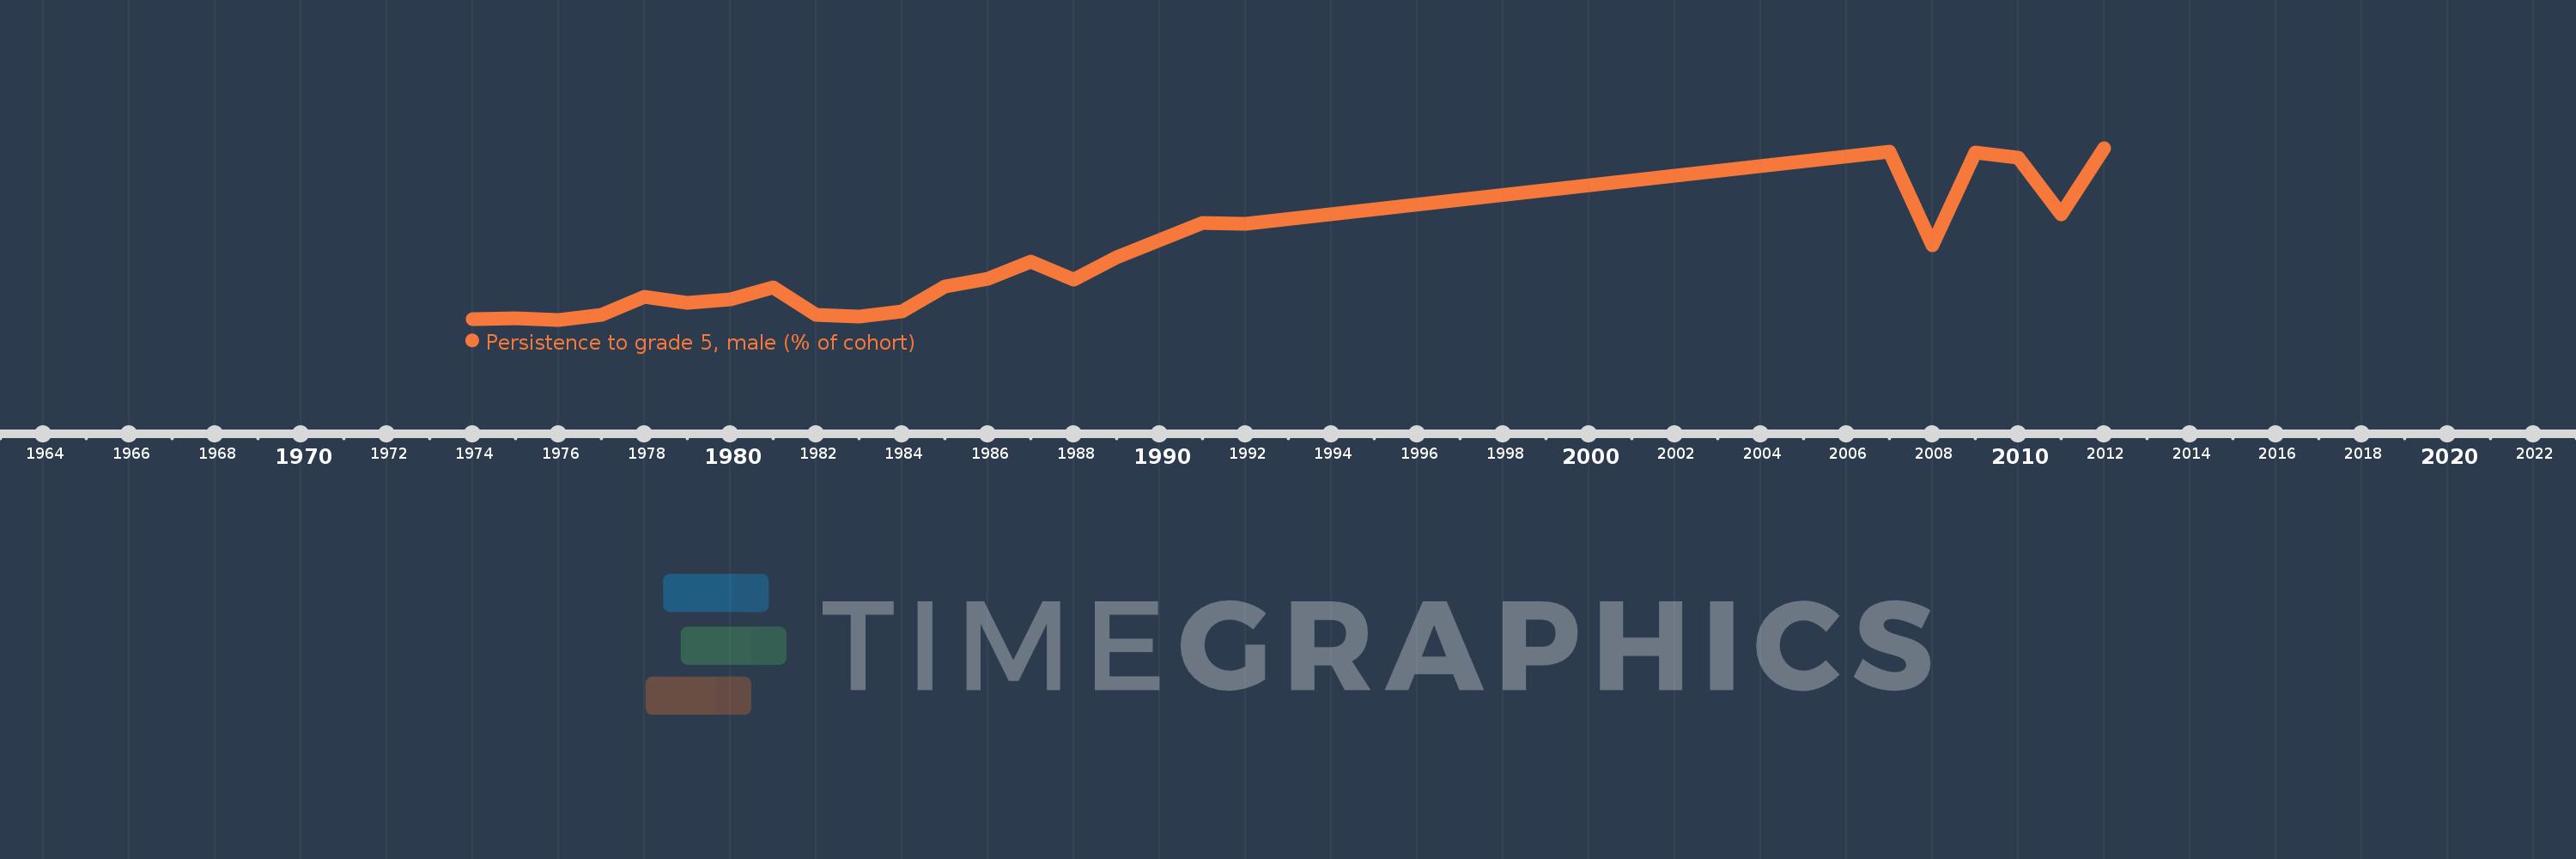
Questa scala temporale mostra un grafico dal 1974 anno al 2012 anno. Cameroon. I dati fino ad 1973 anno non disponibili. Il numero di osservazioni attuali secondo i date: 24.
La fonte (nome):
Indicatori dello sviluppo mondiale
La fonte (organizzazione):
United Nations Educational, Scientific, and Cultural Organization (UNESCO) Institute for Statistics.
Categorie:
Education, Gender
sono stati aggiornati
23 apr 2017 anni
Indicatori delle variazioni dei valori per anni
In media:
60.158
Minima:
51.248
1 gen 1976 anni
Massimo:
77.628
1 gen 2012 anni
Alla data di osservazione
Valore
Variazione assoluta
La variazione rispetto al valore precedente
1 gen 1974 anni
51.381
+51.381
0.0%
1 gen 1975 anni
51.522
+0.141
0.27%
1 gen 1976 anni
51.248
-0.274
-0.53%
1 gen 1977 anni
52.045
+0.797
1.55%
1 gen 1978 anni
54.722
+2.677
5.14%
1 gen 1979 anni
53.814
-0.908
-1.66%
1 gen 1980 anni
54.359
+0.545
1.01%
1 gen 1981 anni
56.166
+1.807
3.32%
1 gen 1982 anni
51.954
-4.212
-7.5%
1 gen 1983 anni
51.711
-0.243
-0.47%
1 gen 1984 anni
52.573
+0.862
1.67%
1 gen 1985 anni
56.351
+3.778
7.19%
1 gen 1986 anni
57.512
+1.162
2.06%
1 gen 1987 anni
60.182
+2.669
4.64%
1 gen 1988 anni
57.451
-2.73
-4.54%
1 gen 1989 anni
60.801
+3.35
5.83%
1 gen 1991 anni
66.141
+5.339
8.78%
1 gen 1992 anni
66.044
-0.096
-0.15%
1 gen 2007 anni
77.043
+10.998
16.65%
1 gen 2008 anni
62.73
-14.313
-18.58%
1 gen 2009 anni
76.889
+14.159
22.57%
1 gen 2010 anni
76.073
-0.816
-1.06%
1 gen 2011 anni
67.461
-8.612
-11.32%
1 gen 2012 anni
77.628
+10.168
15.07%
Classificazione dei paesi secondo i statistiche attuali per anni

Commenti:

Inviare
PremiumAbout & FeedbackAccordoPrivatezza
logo
© 2022 Selected Technologies LLC – Morgan Hill, California