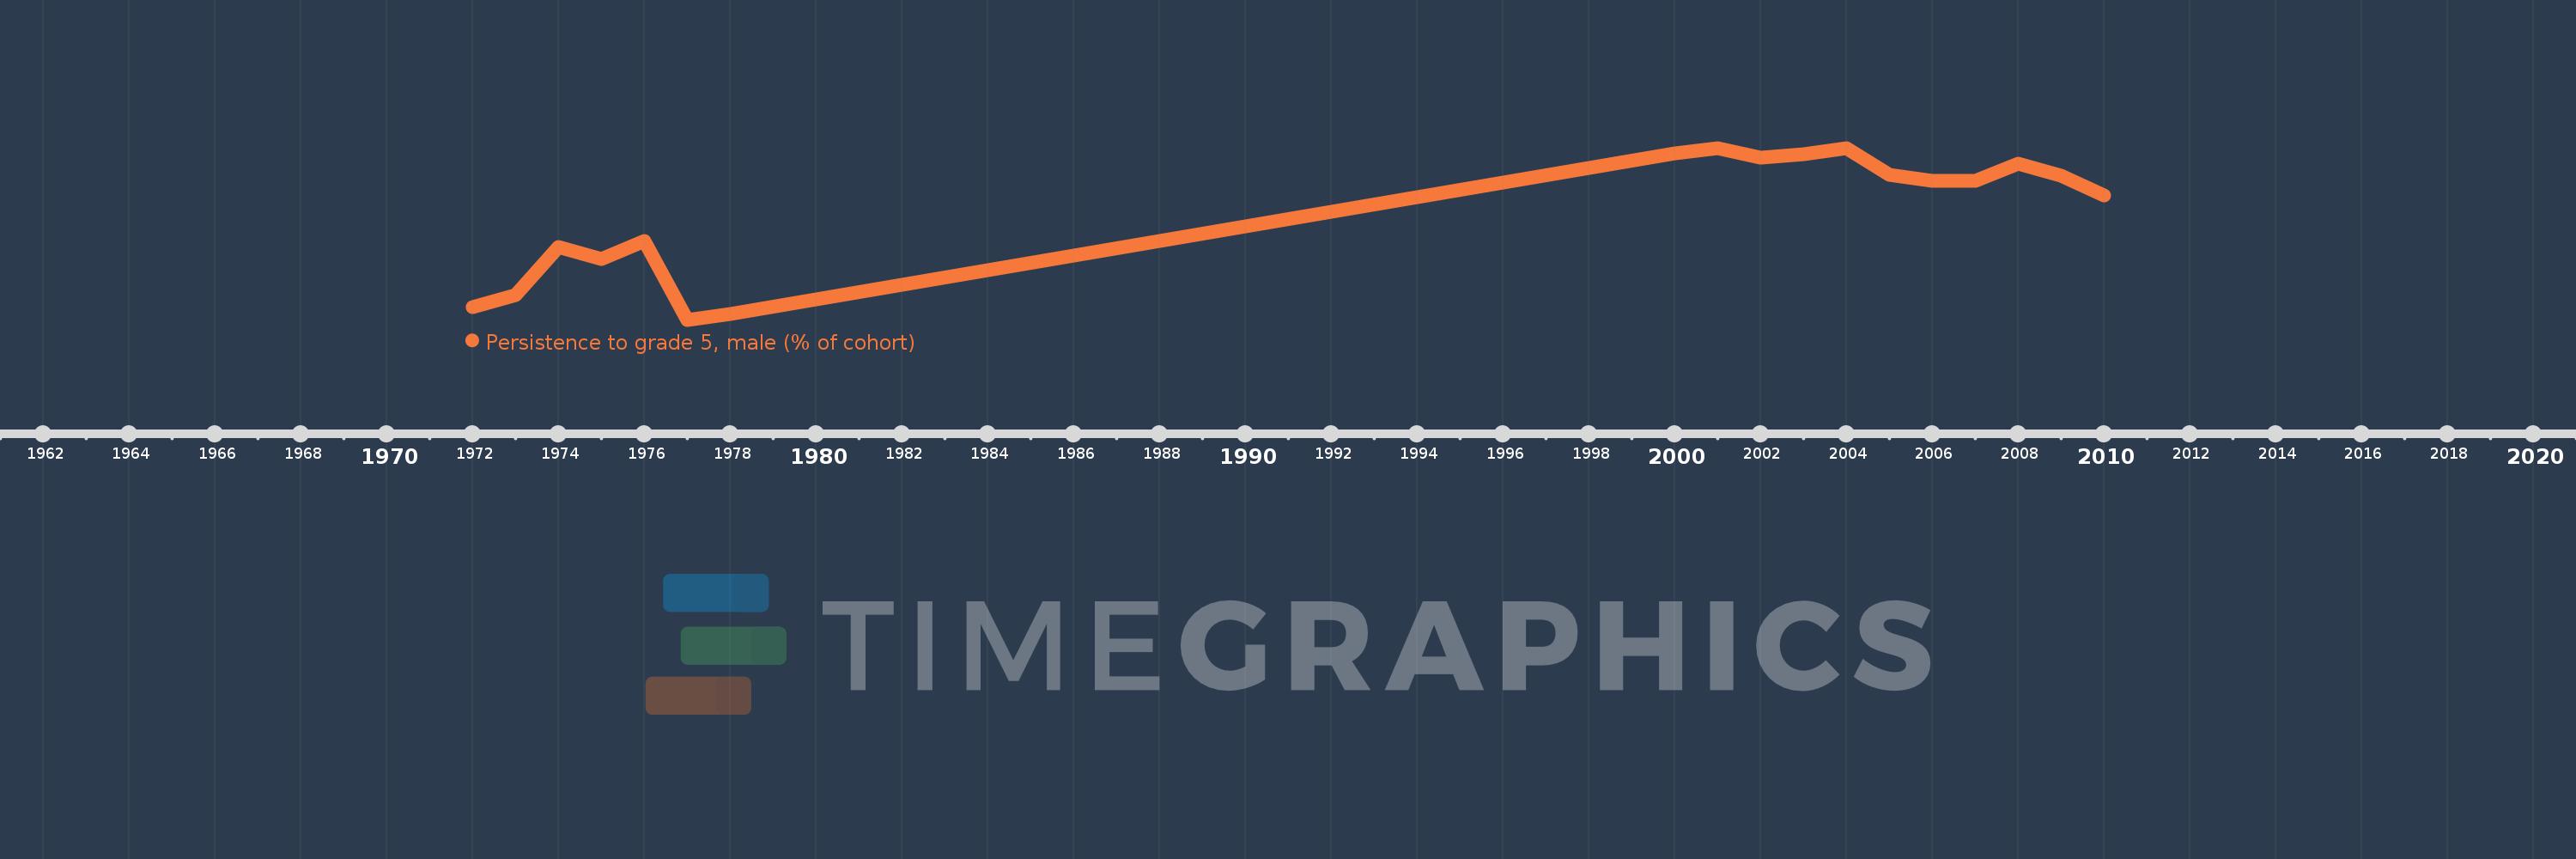
Questa scala temporale mostra un grafico dal 1972 anno al 2010 anno. Netherlands. I dati fino ad 1971 anno non disponibili. Il numero di osservazioni attuali secondo i date: 18.
La fonte (nome):
Indicatori dello sviluppo mondiale
La fonte (organizzazione):
United Nations Educational, Scientific, and Cultural Organization (UNESCO) Institute for Statistics.
Categorie:
Education, Gender
sono stati aggiornati
23 apr 2017 anni
Indicatori delle variazioni dei valori per anni
In media:
97.326
Minima:
92.906
1 gen 1977 anni
Massimo:
99.951
1 gen 2001 anni
Alla data di osservazione
Valore
Variazione assoluta
La variazione rispetto al valore precedente
1 gen 1972 anni
93.429
+93.429
0.0%
1 gen 1973 anni
93.934
+0.505
0.54%
1 gen 1974 anni
95.896
+1.962
2.09%
1 gen 1975 anni
95.41
-0.487
-0.51%
1 gen 1976 anni
96.126
+0.716
0.75%
1 gen 1977 anni
92.906
-3.219
-3.35%
1 gen 1978 anni
93.153
+0.247
0.27%
1 gen 2000 anni
99.734
+6.581
7.06%
1 gen 2001 anni
99.951
+0.217
0.22%
1 gen 2002 anni
99.553
-0.398
-0.4%
1 gen 2003 anni
99.701
+0.148
0.15%
1 gen 2004 anni
99.924
+0.223
0.22%
1 gen 2005 anni
98.847
-1.078
-1.08%
1 gen 2006 anni
98.618
-0.228
-0.23%
1 gen 2007 anni
98.586
-0.032
-0.03%
1 gen 2008 anni
99.294
+0.708
0.72%
1 gen 2009 anni
98.796
-0.498
-0.5%
1 gen 2010 anni
98.007
-0.789
-0.8%
Classificazione dei paesi secondo i statistiche attuali per anni