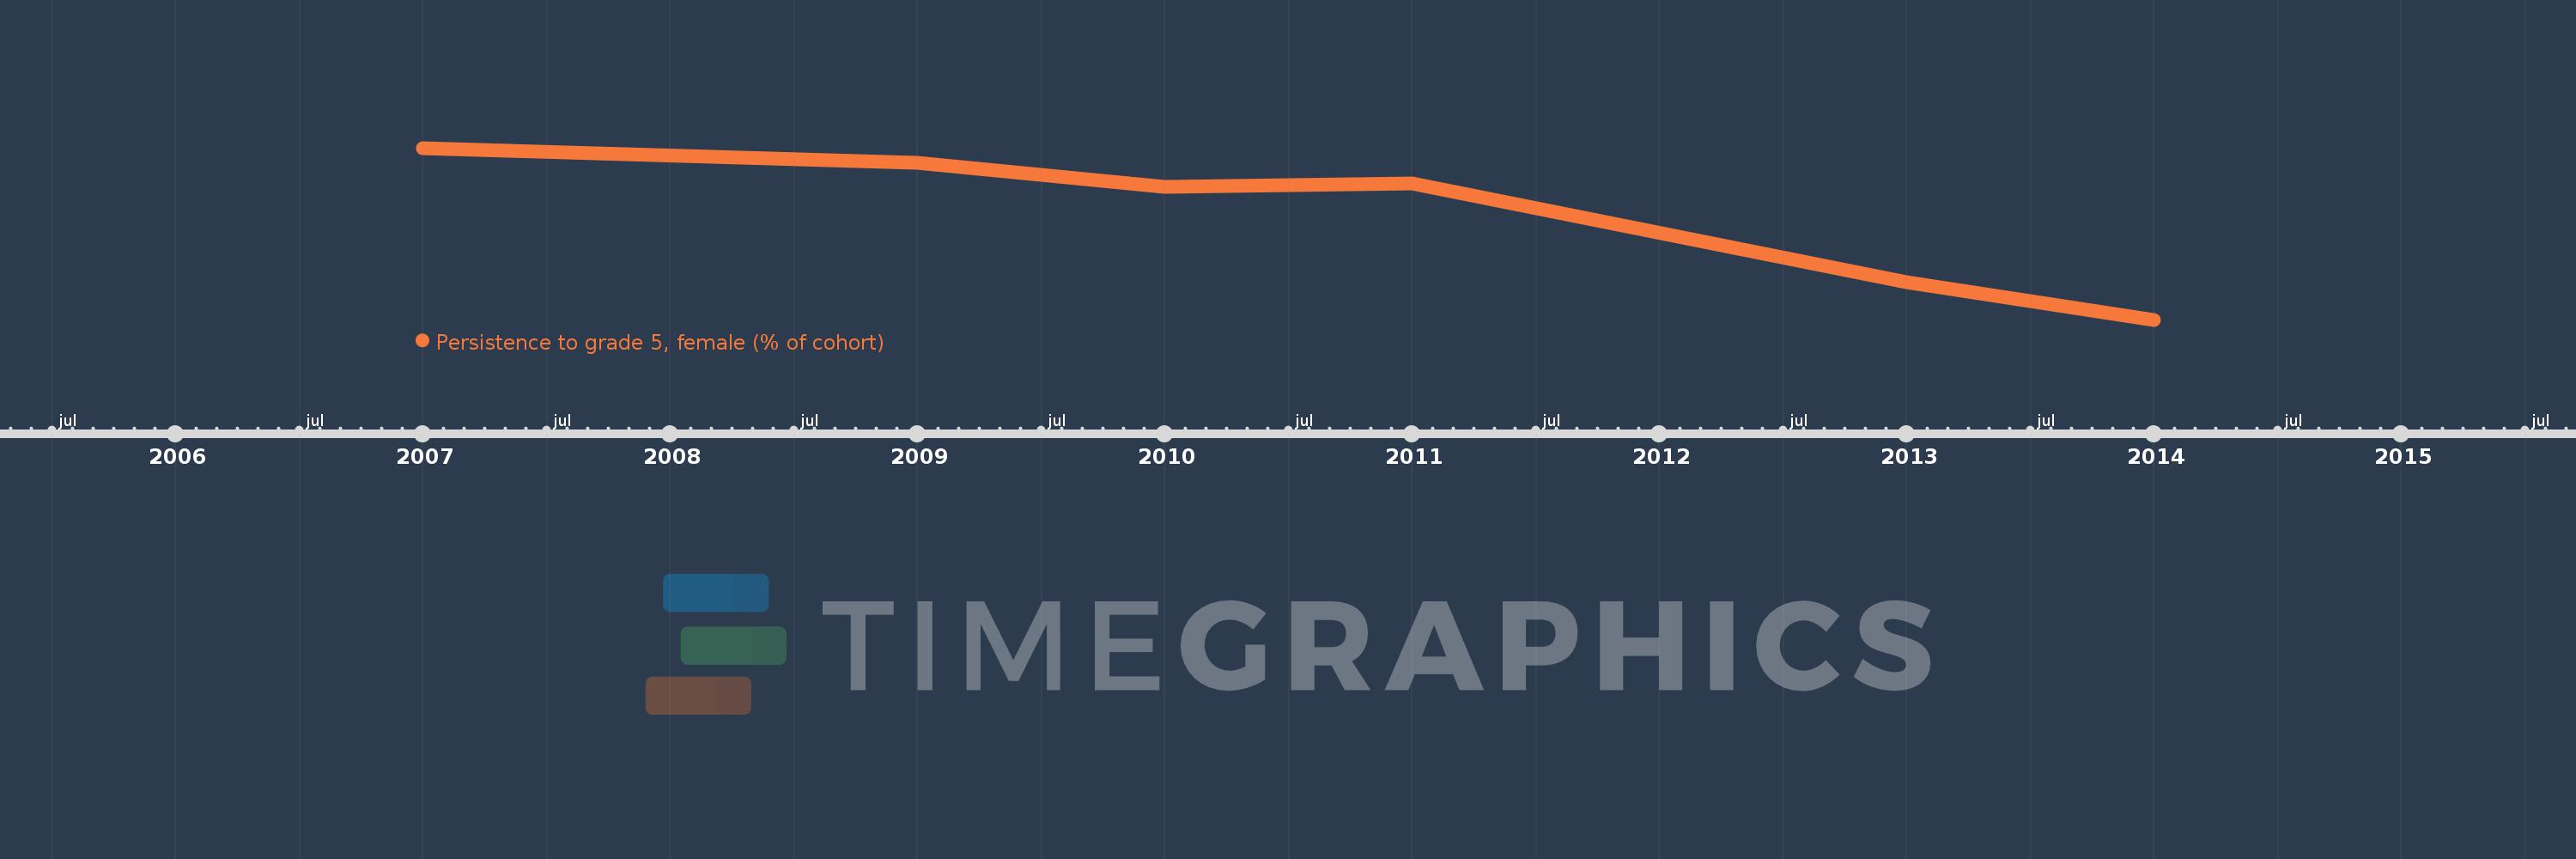
Questa scala temporale mostra un grafico dal 2007 anno al 2014 anno. Late-demographic dividend. I dati fino ad 2006 anno non disponibili. Il numero di osservazioni attuali secondo i date: 6.
La fonte (nome):
Indicatori dello sviluppo mondiale
La fonte (organizzazione):
United Nations Educational, Scientific, and Cultural Organization (UNESCO) Institute for Statistics.
Categorie:
Education, Gender
sono stati aggiornati
23 apr 2017 anni
Indicatori delle variazioni dei valori per anni
In media:
92.974
Minima:
84.354
1 gen 2014 anni
Massimo:
98.322
1 gen 2007 anni
Alla data di osservazione
Valore
Variazione assoluta
La variazione rispetto al valore precedente
1 gen 2007 anni
98.322
+98.322
0.0%
1 gen 2009 anni
97.144
-1.179
-1.2%
1 gen 2010 anni
95.189
-1.955
-2.01%
1 gen 2011 anni
95.449
+0.26
0.27%
1 gen 2013 anni
87.385
-8.064
-8.45%
1 gen 2014 anni
84.354
-3.031
-3.47%
Classificazione dei paesi secondo i statistiche attuali per anni