33
/it/
AIzaSyB4mHJ5NPEv-XzF7P6NDYXjlkCWaeKw5bc
November 30, 2025
123966
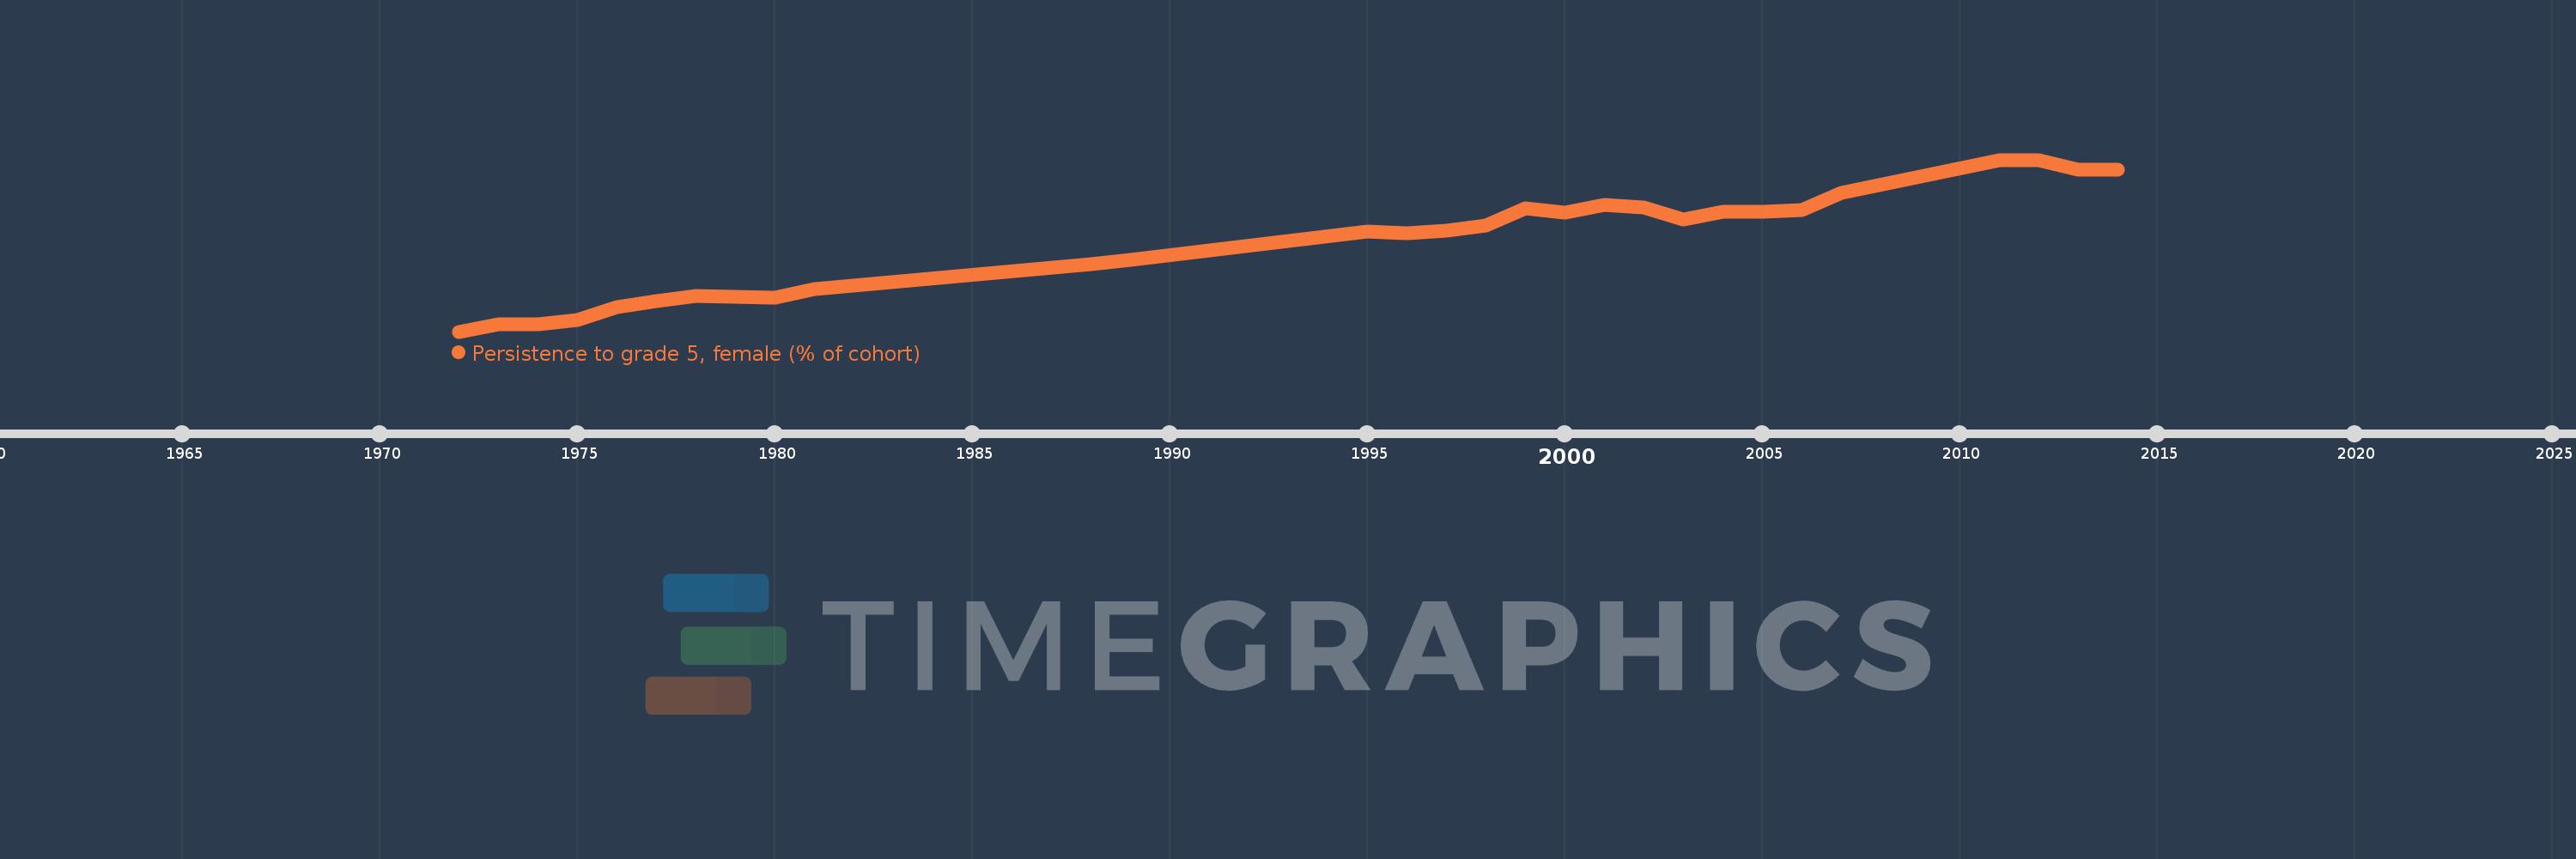
Ecuador
ECU
true
2
1
Persistence to grade 5, female (% of cohort)
2014,2013,2012,2011,2007,2006,2005,2004,2003,2002,2001,2000,1999,1998,1997,1996,1995,1989,1988,1981,1980,1979,1978,1977,1976,1975,1974,1973,1972