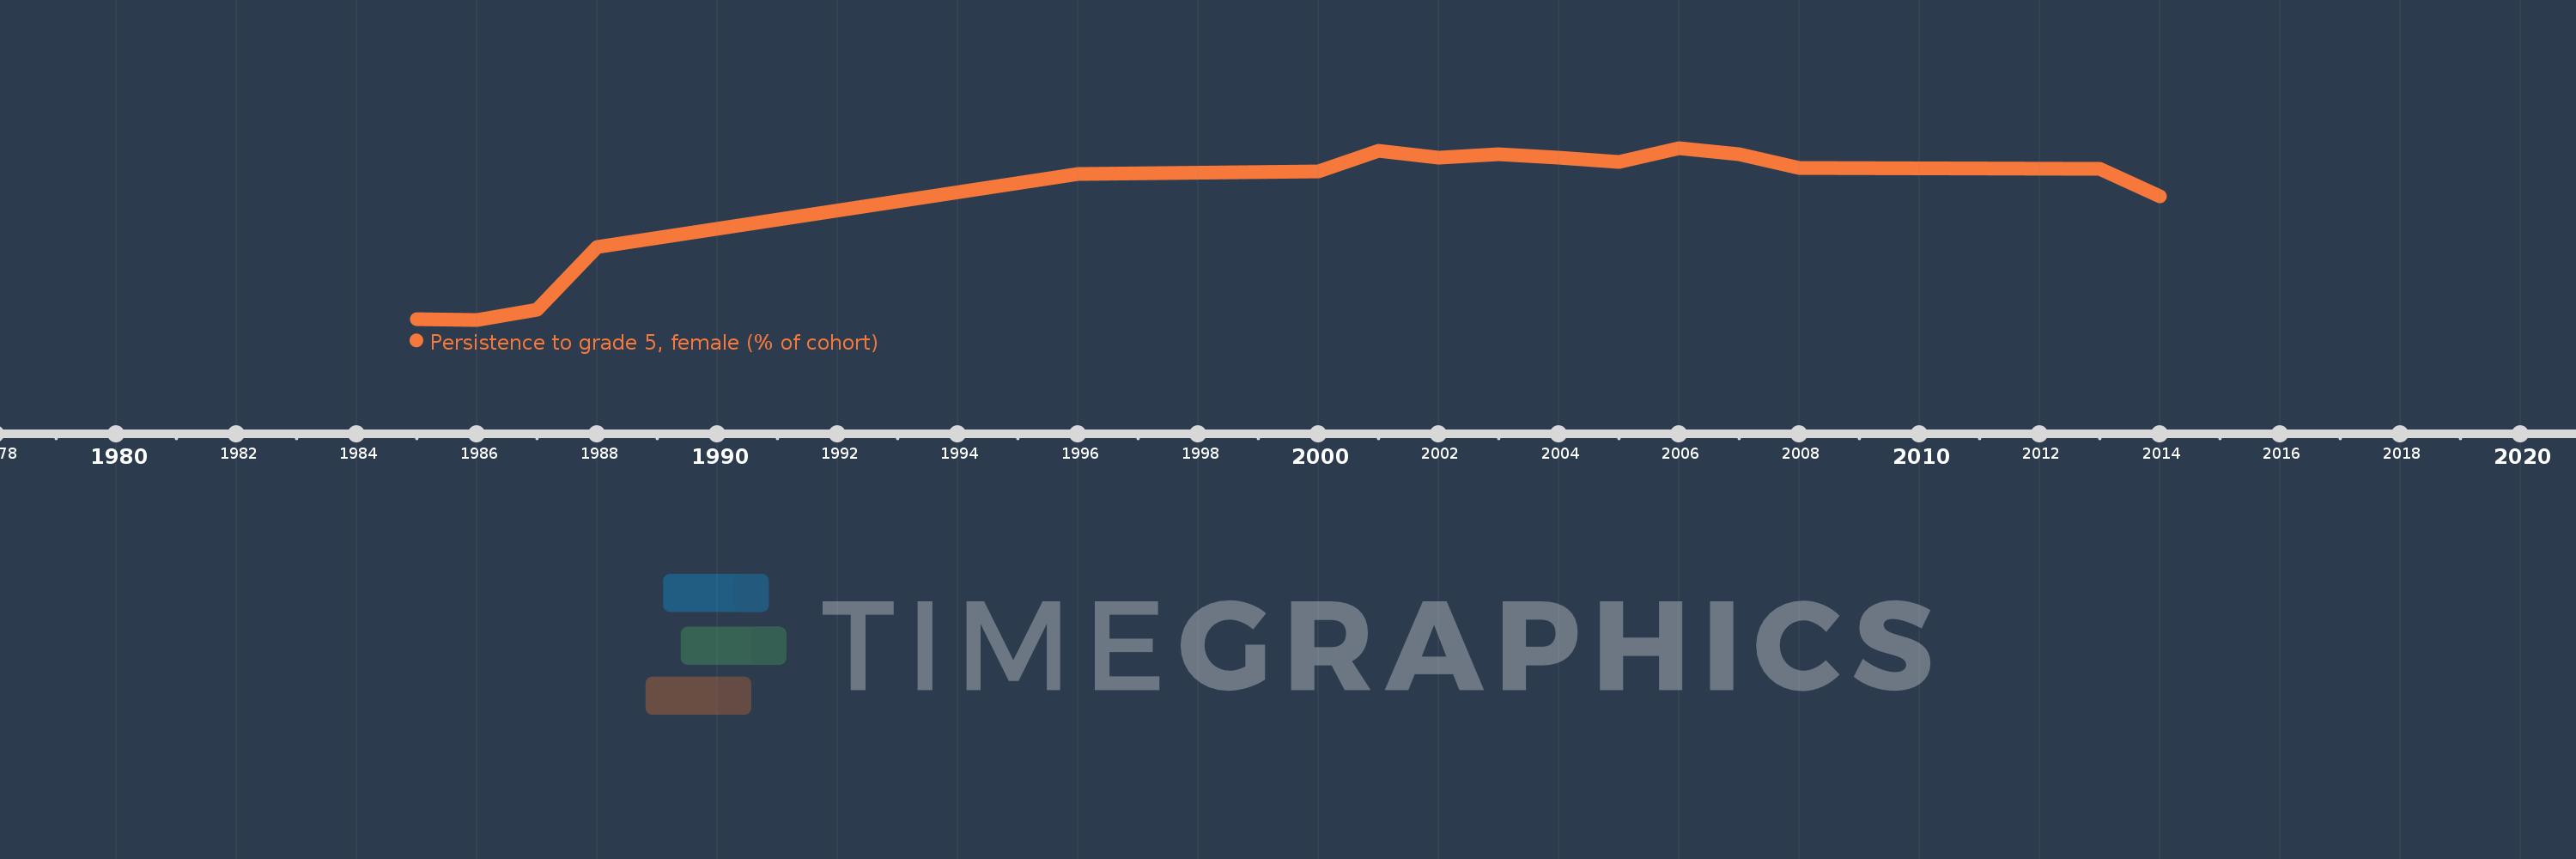
Questa scala temporale mostra un grafico dal 1985 anno al 2014 anno. Cyprus. I dati fino ad 1984 anno non disponibili. Il numero di osservazioni attuali secondo i date: 16.
La fonte (nome):
Indicatori dello sviluppo mondiale
La fonte (organizzazione):
United Nations Educational, Scientific, and Cultural Organization (UNESCO) Institute for Statistics.
Categorie:
Education, Gender
sono stati aggiornati
23 apr 2017 anni
Indicatori delle variazioni dei valori per anni
In media:
92.58
Minima:
75.069
1 gen 1986 anni
Massimo:
99.659
1 gen 2006 anni
Alla data di osservazione
Valore
Variazione assoluta
La variazione rispetto al valore precedente
1 gen 1985 anni
75.138
+75.138
0.0%
1 gen 1986 anni
75.069
-0.069
-0.09%
1 gen 1987 anni
76.511
+1.441
1.92%
1 gen 1988 anni
85.427
+8.916
11.65%
1 gen 1996 anni
95.936
+10.509
12.3%
1 gen 2000 anni
96.312
+0.376
0.39%
1 gen 2001 anni
99.273
+2.961
3.07%
1 gen 2002 anni
98.293
-0.98
-0.99%
1 gen 2003 anni
98.724
+0.431
0.44%
1 gen 2004 anni
98.294
-0.43
-0.44%
1 gen 2005 anni
97.714
-0.58
-0.59%
1 gen 2006 anni
99.659
+1.946
1.99%
1 gen 2007 anni
98.777
-0.883
-0.89%
1 gen 2008 anni
96.772
-2.005
-2.03%
1 gen 2013 anni
96.661
-0.111
-0.11%
1 gen 2014 anni
92.712
-3.949
-4.09%
Classificazione dei paesi secondo i statistiche attuali per anni