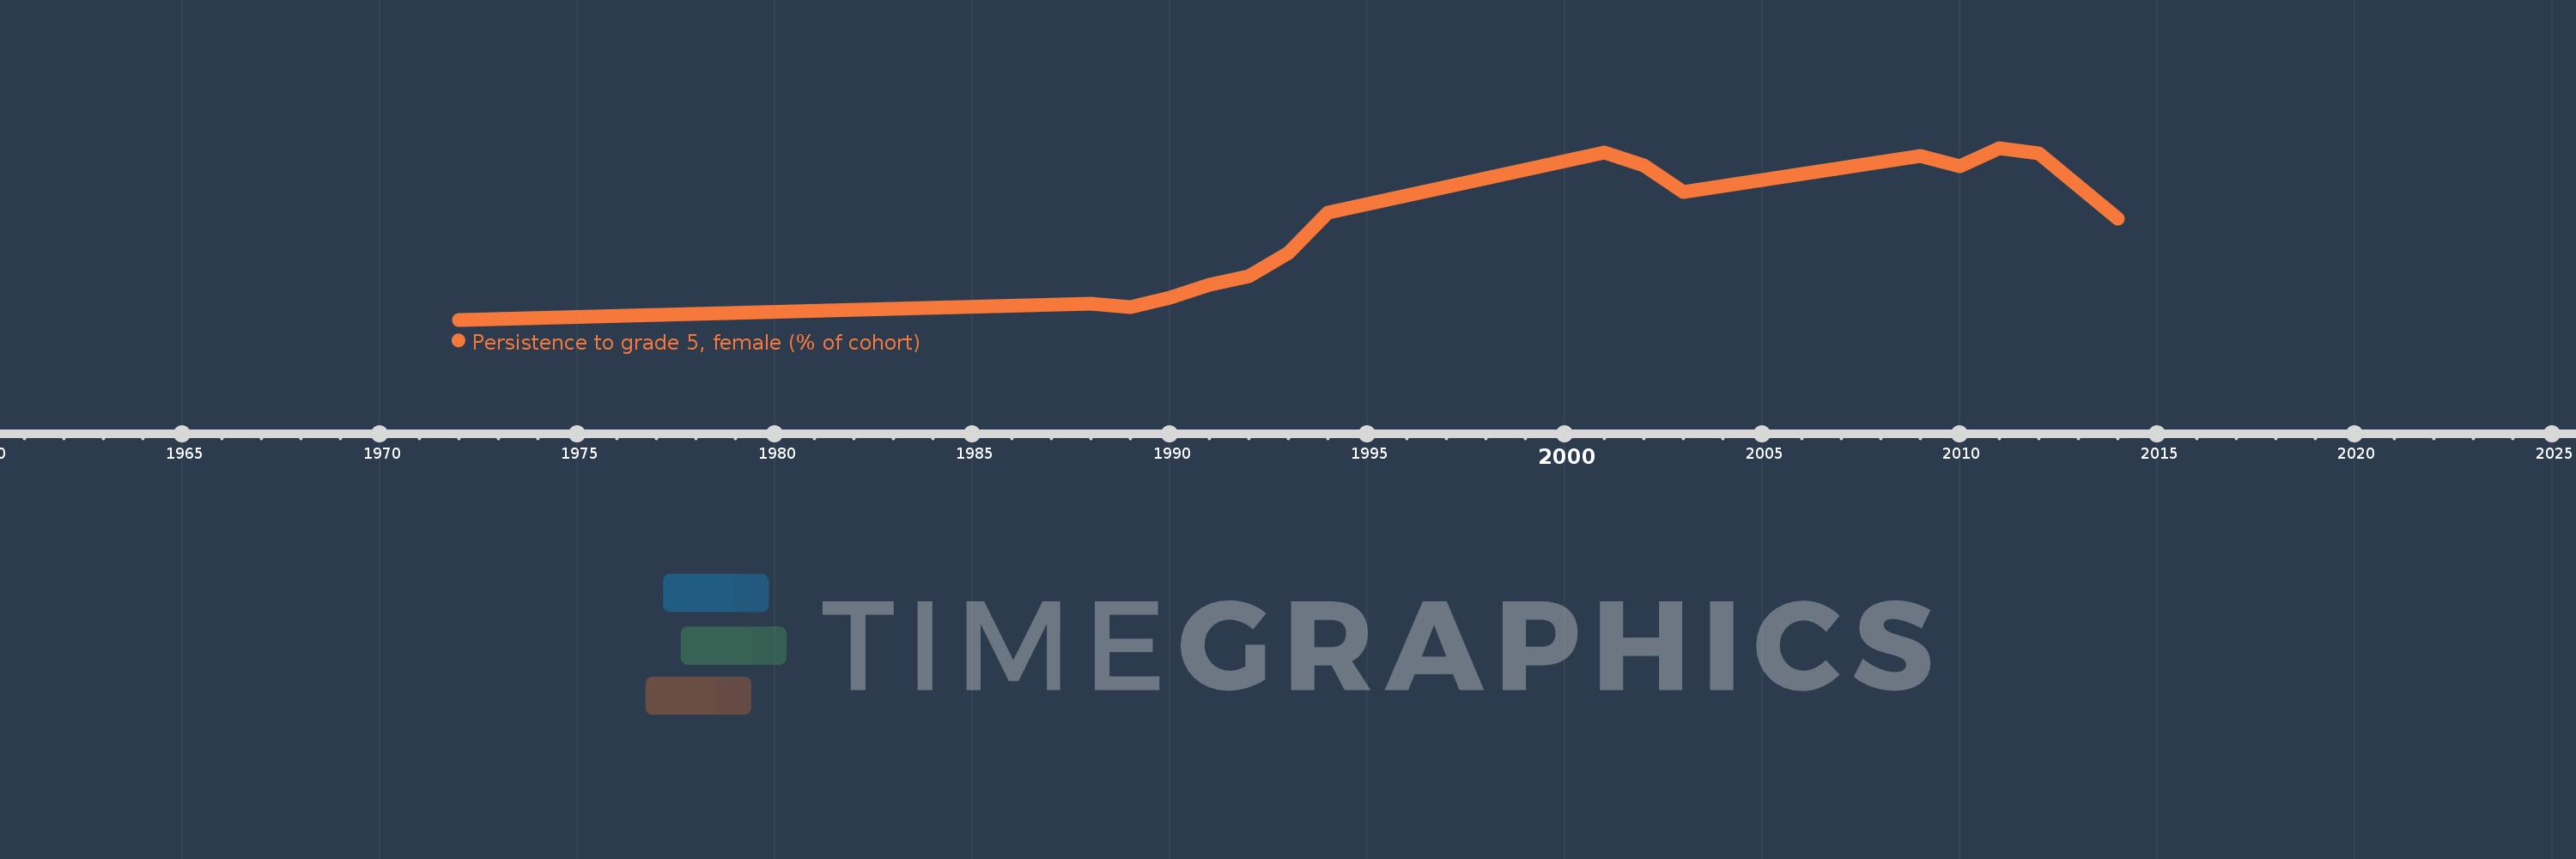
Questa scala temporale mostra un grafico dal 1972 anno al 2014 anno. Iran, Islamic Rep.. I dati fino ad 1971 anno non disponibili. Il numero di osservazioni attuali secondo i date: 16.
La fonte (nome):
Indicatori dello sviluppo mondiale
La fonte (organizzazione):
United Nations Educational, Scientific, and Cultural Organization (UNESCO) Institute for Statistics.
Categorie:
Education, Gender
sono stati aggiornati
23 apr 2017 anni
Indicatori delle variazioni dei valori per anni
In media:
79.164
Minima:
56.394
1 gen 1972 anni
Massimo:
97.901
1 gen 2011 anni
Alla data di osservazione
Valore
Variazione assoluta
La variazione rispetto al valore precedente
1 gen 1972 anni
56.394
+56.394
0.0%
1 gen 1988 anni
60.26
+3.866
6.86%
1 gen 1989 anni
59.422
-0.838
-1.39%
1 gen 1990 anni
61.633
+2.211
3.72%
1 gen 1991 anni
64.866
+3.232
5.24%
1 gen 1992 anni
66.967
+2.101
3.24%
1 gen 1993 anni
72.601
+5.634
8.41%
1 gen 1994 anni
82.209
+9.608
13.23%
1 gen 2001 anni
96.745
+14.536
17.68%
1 gen 2002 anni
93.713
-3.032
-3.13%
1 gen 2003 anni
87.161
-6.552
-6.99%
1 gen 2009 anni
95.988
+8.828
10.13%
1 gen 2010 anni
93.485
-2.503
-2.61%
1 gen 2011 anni
97.901
+4.416
4.72%
1 gen 2012 anni
96.553
-1.348
-1.38%
1 gen 2014 anni
80.731
-15.822
-16.39%
Classificazione dei paesi secondo i statistiche attuali per anni