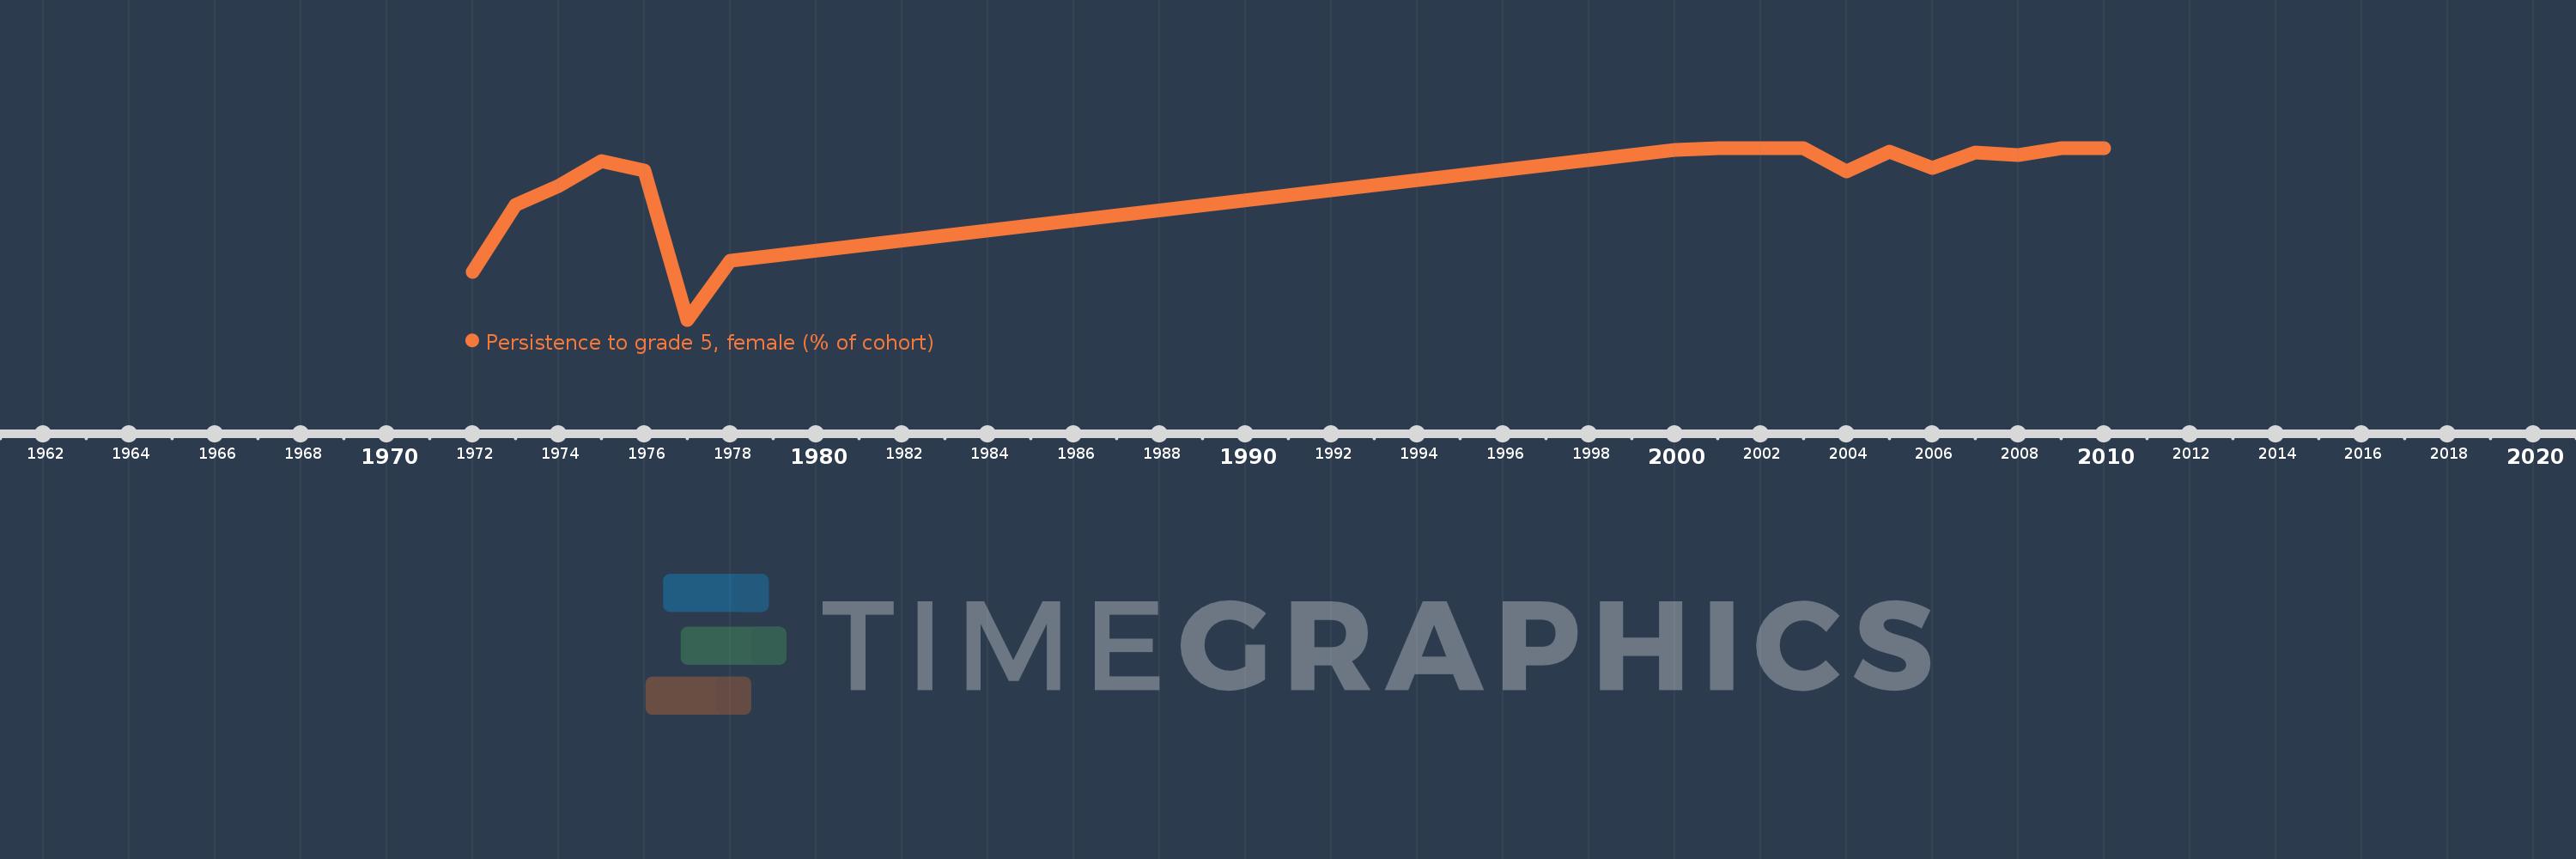
Questa scala temporale mostra un grafico dal 1972 anno al 2010 anno. Netherlands. I dati fino ad 1971 anno non disponibili. Il numero di osservazioni attuali secondo i date: 18.
La fonte (nome):
Indicatori dello sviluppo mondiale
La fonte (organizzazione):
United Nations Educational, Scientific, and Cultural Organization (UNESCO) Institute for Statistics.
Categorie:
Education, Gender
sono stati aggiornati
23 apr 2017 anni
Indicatori delle variazioni dei valori per anni
In media:
98.814
Minima:
93.902
1 gen 1977 anni
Massimo:
100.0
1 gen 2002 anni
Alla data di osservazione
Valore
Variazione assoluta
La variazione rispetto al valore precedente
1 gen 1972 anni
95.606
+95.606
0.0%
1 gen 1973 anni
97.975
+2.369
2.48%
1 gen 1974 anni
98.655
+0.68
0.69%
1 gen 1975 anni
99.532
+0.877
0.89%
1 gen 1976 anni
99.184
-0.347
-0.35%
1 gen 1977 anni
93.902
-5.282
-5.33%
1 gen 1978 anni
95.997
+2.095
2.23%
1 gen 2000 anni
99.916
+3.919
4.08%
1 gen 2001 anni
99.981
+0.065
0.06%
1 gen 2002 anni
100.0
+0.019
0.02%
1 gen 2003 anni
99.999
-0.001
0.0%
1 gen 2004 anni
99.16
-0.839
-0.84%
1 gen 2005 anni
99.868
+0.708
0.71%
1 gen 2006 anni
99.279
-0.589
-0.59%
1 gen 2007 anni
99.844
+0.565
0.57%
1 gen 2008 anni
99.757
-0.087
-0.09%
1 gen 2009 anni
100.0
+0.243
0.24%
1 gen 2010 anni
100.0
0.0
0.0%
Classificazione dei paesi secondo i statistiche attuali per anni