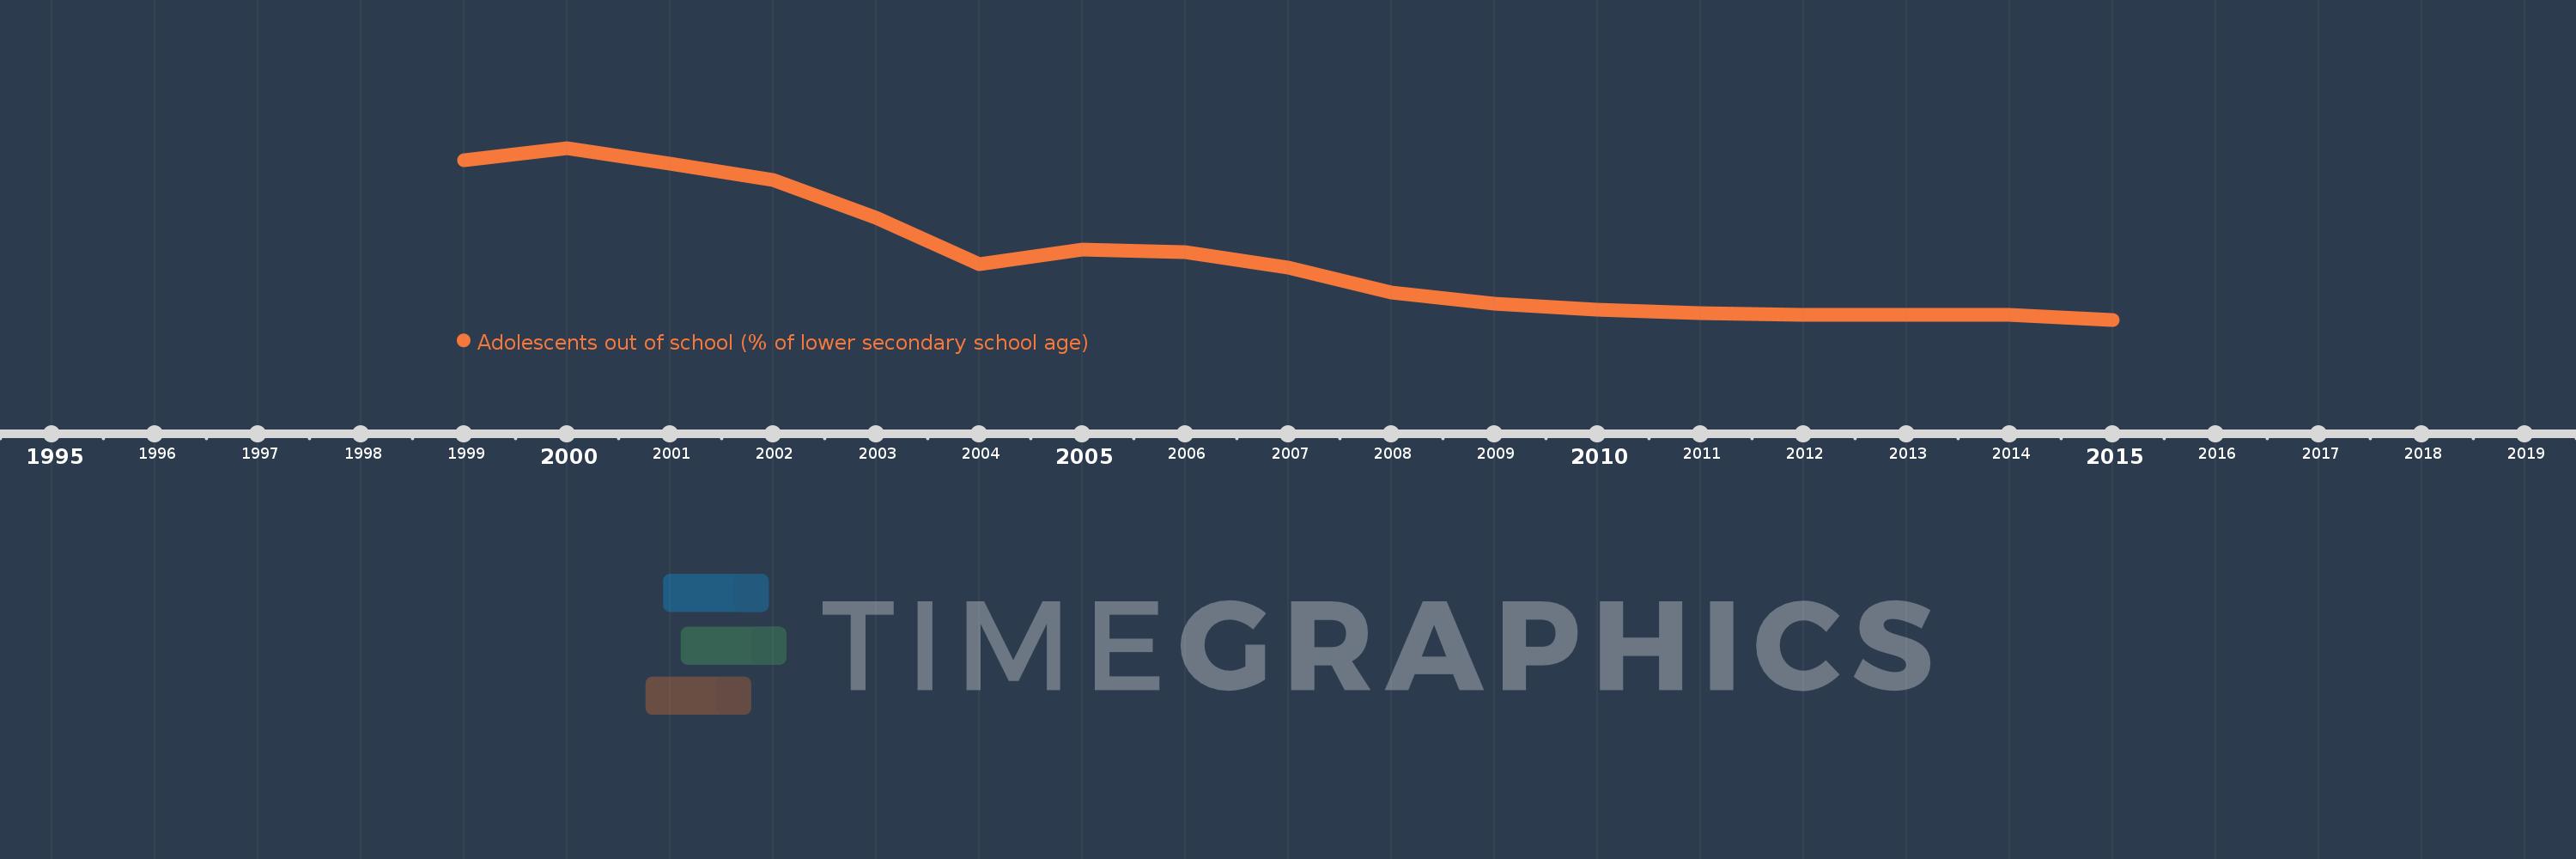
Questa scala temporale mostra un grafico dal 1999 anno al 2015 anno. Late-demographic dividend. I dati fino ad 1998 anno non disponibili. Il numero di osservazioni attuali secondo i date: 17.
La fonte (nome):
Indicatori dello sviluppo mondiale
La fonte (organizzazione):
United Nations Educational, Scientific, and Cultural Organization (UNESCO) Institute for Statistics.
Categorie:
Education
sono stati aggiornati
23 apr 2017 anni
Indicatori delle variazioni dei valori per anni
In media:
9.911
Minima:
6.329
1 gen 2015 anni
Massimo:
16.286
1 gen 2000 anni
Alla data di osservazione
Valore
Variazione assoluta
La variazione rispetto al valore precedente
1 gen 1999 anni
15.566
+15.566
0.0%
1 gen 2000 anni
16.286
+0.721
4.63%
1 gen 2001 anni
15.364
-0.923
-5.67%
1 gen 2002 anni
14.451
-0.913
-5.94%
1 gen 2003 anni
12.233
-2.218
-15.35%
1 gen 2004 anni
9.558
-2.675
-21.87%
1 gen 2005 anni
10.392
+0.834
8.72%
1 gen 2006 anni
10.271
-0.121
-1.17%
1 gen 2007 anni
9.353
-0.917
-8.93%
1 gen 2008 anni
7.9
-1.453
-15.54%
1 gen 2009 anni
7.248
-0.652
-8.26%
1 gen 2010 anni
6.919
-0.329
-4.54%
1 gen 2011 anni
6.735
-0.184
-2.67%
1 gen 2012 anni
6.625
-0.11
-1.63%
1 gen 2013 anni
6.625
0.0
0.0%
1 gen 2014 anni
6.633
+0.008
0.13%
1 gen 2015 anni
6.329
-0.305
-4.59%
Classificazione dei paesi secondo i statistiche attuali per anni