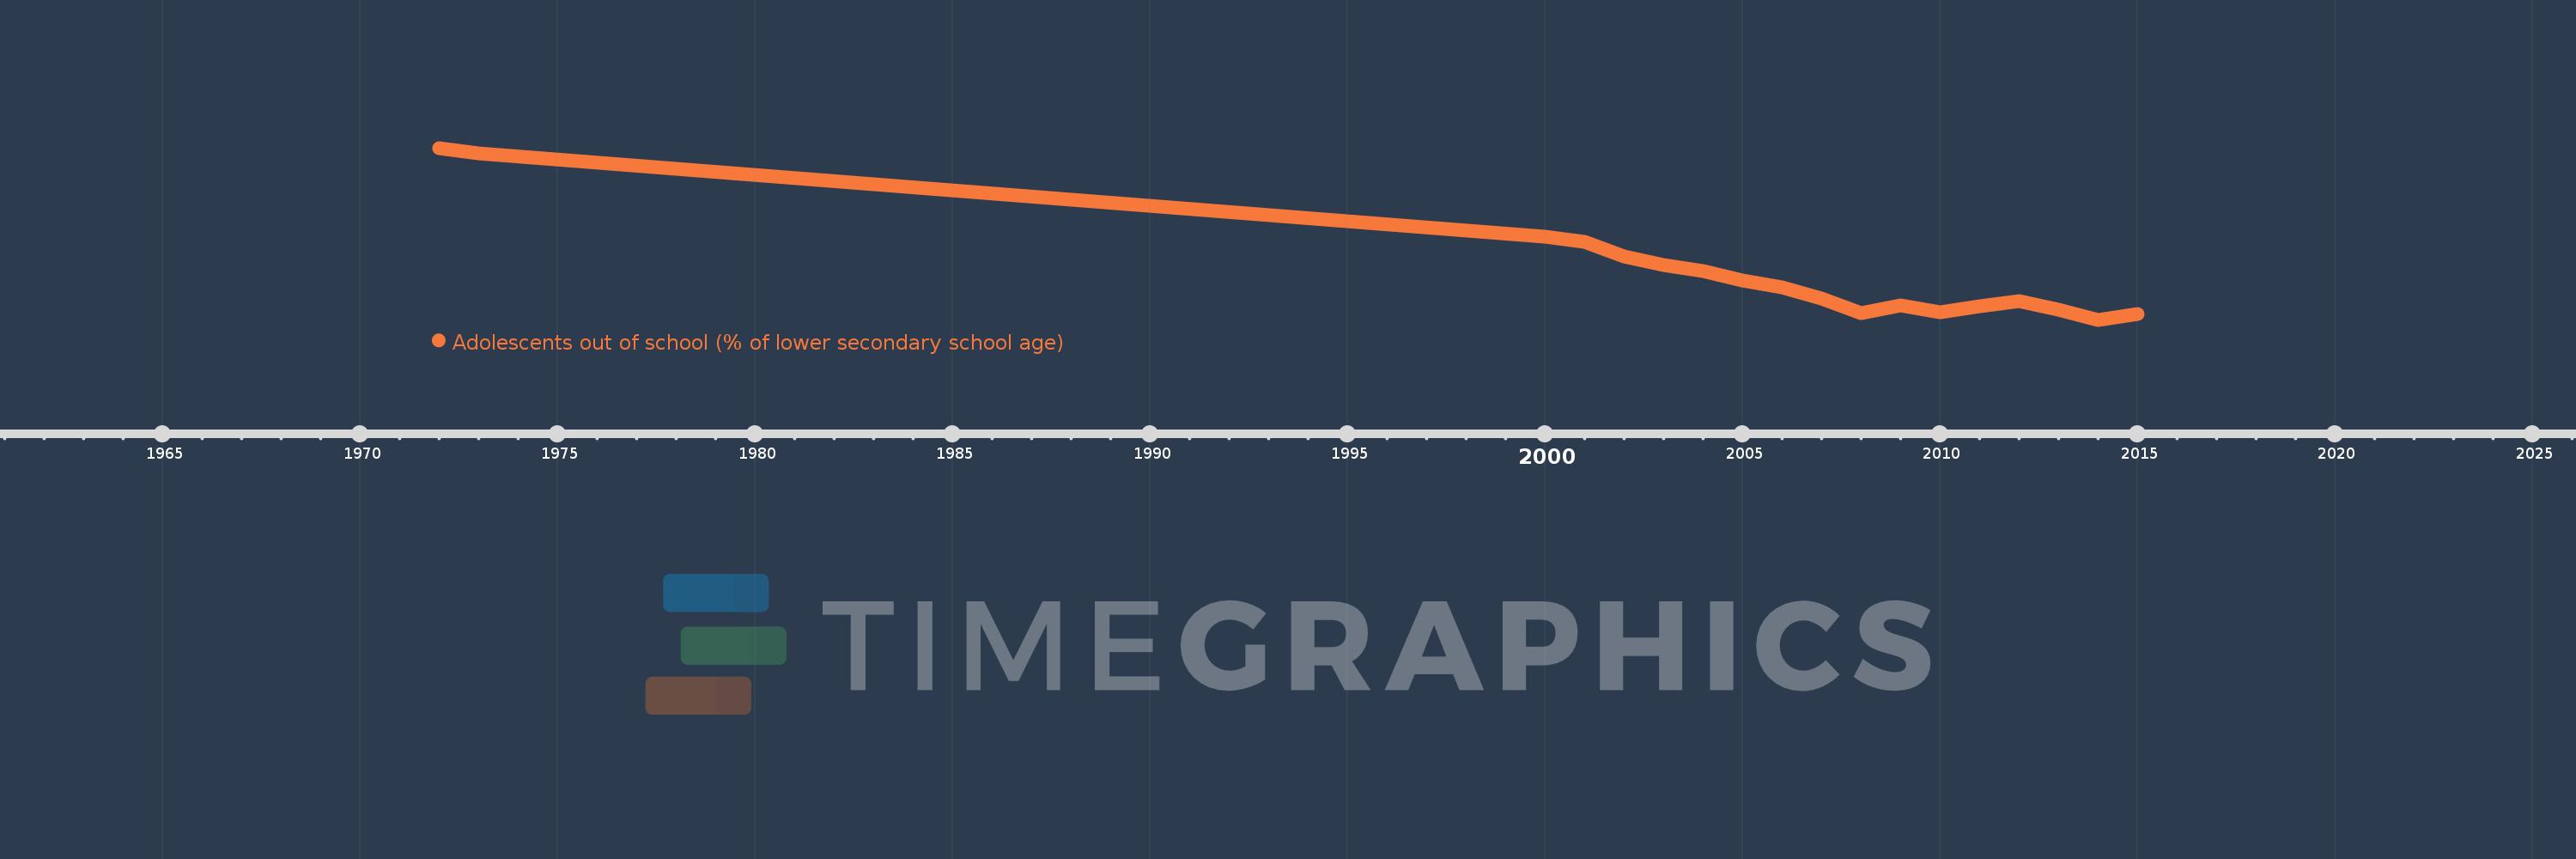
Questa scala temporale mostra un grafico dal 1972 anno al 2015 anno. Venezuela, RB. I dati fino ad 1971 anno non disponibili. Il numero di osservazioni attuali secondo i date: 18.
La fonte (nome):
Indicatori dello sviluppo mondiale
La fonte (organizzazione):
United Nations Educational, Scientific, and Cultural Organization (UNESCO) Institute for Statistics.
Categorie:
Education
sono stati aggiornati
23 apr 2017 anni
Indicatori delle variazioni dei valori per anni
In media:
17.614
Minima:
6.614
1 gen 2014 anni
Massimo:
47.308
1 gen 1972 anni
Alla data di osservazione
Valore
Variazione assoluta
La variazione rispetto al valore precedente
1 gen 1972 anni
47.308
+47.308
0.0%
1 gen 1973 anni
46.072
-1.236
-2.61%
1 gen 2000 anni
26.303
-19.769
-42.91%
1 gen 2001 anni
25.146
-1.157
-4.4%
1 gen 2002 anni
21.672
-3.474
-13.81%
1 gen 2003 anni
19.583
-2.089
-9.64%
1 gen 2004 anni
18.219
-1.365
-6.97%
1 gen 2005 anni
15.82
-2.399
-13.17%
1 gen 2006 anni
14.362
-1.458
-9.21%
1 gen 2007 anni
11.563
-2.799
-19.49%
1 gen 2008 anni
8.23
-3.333
-28.83%
1 gen 2009 anni
9.931
+1.701
20.67%
1 gen 2010 anni
8.42
-1.511
-15.21%
1 gen 2011 anni
9.831
+1.411
16.76%
1 gen 2012 anni
10.967
+1.135
11.55%
1 gen 2013 anni
9.004
-1.962
-17.89%
1 gen 2014 anni
6.614
-2.39
-26.55%
1 gen 2015 anni
7.997
+1.384
20.92%
Classificazione dei paesi secondo i statistiche attuali per anni