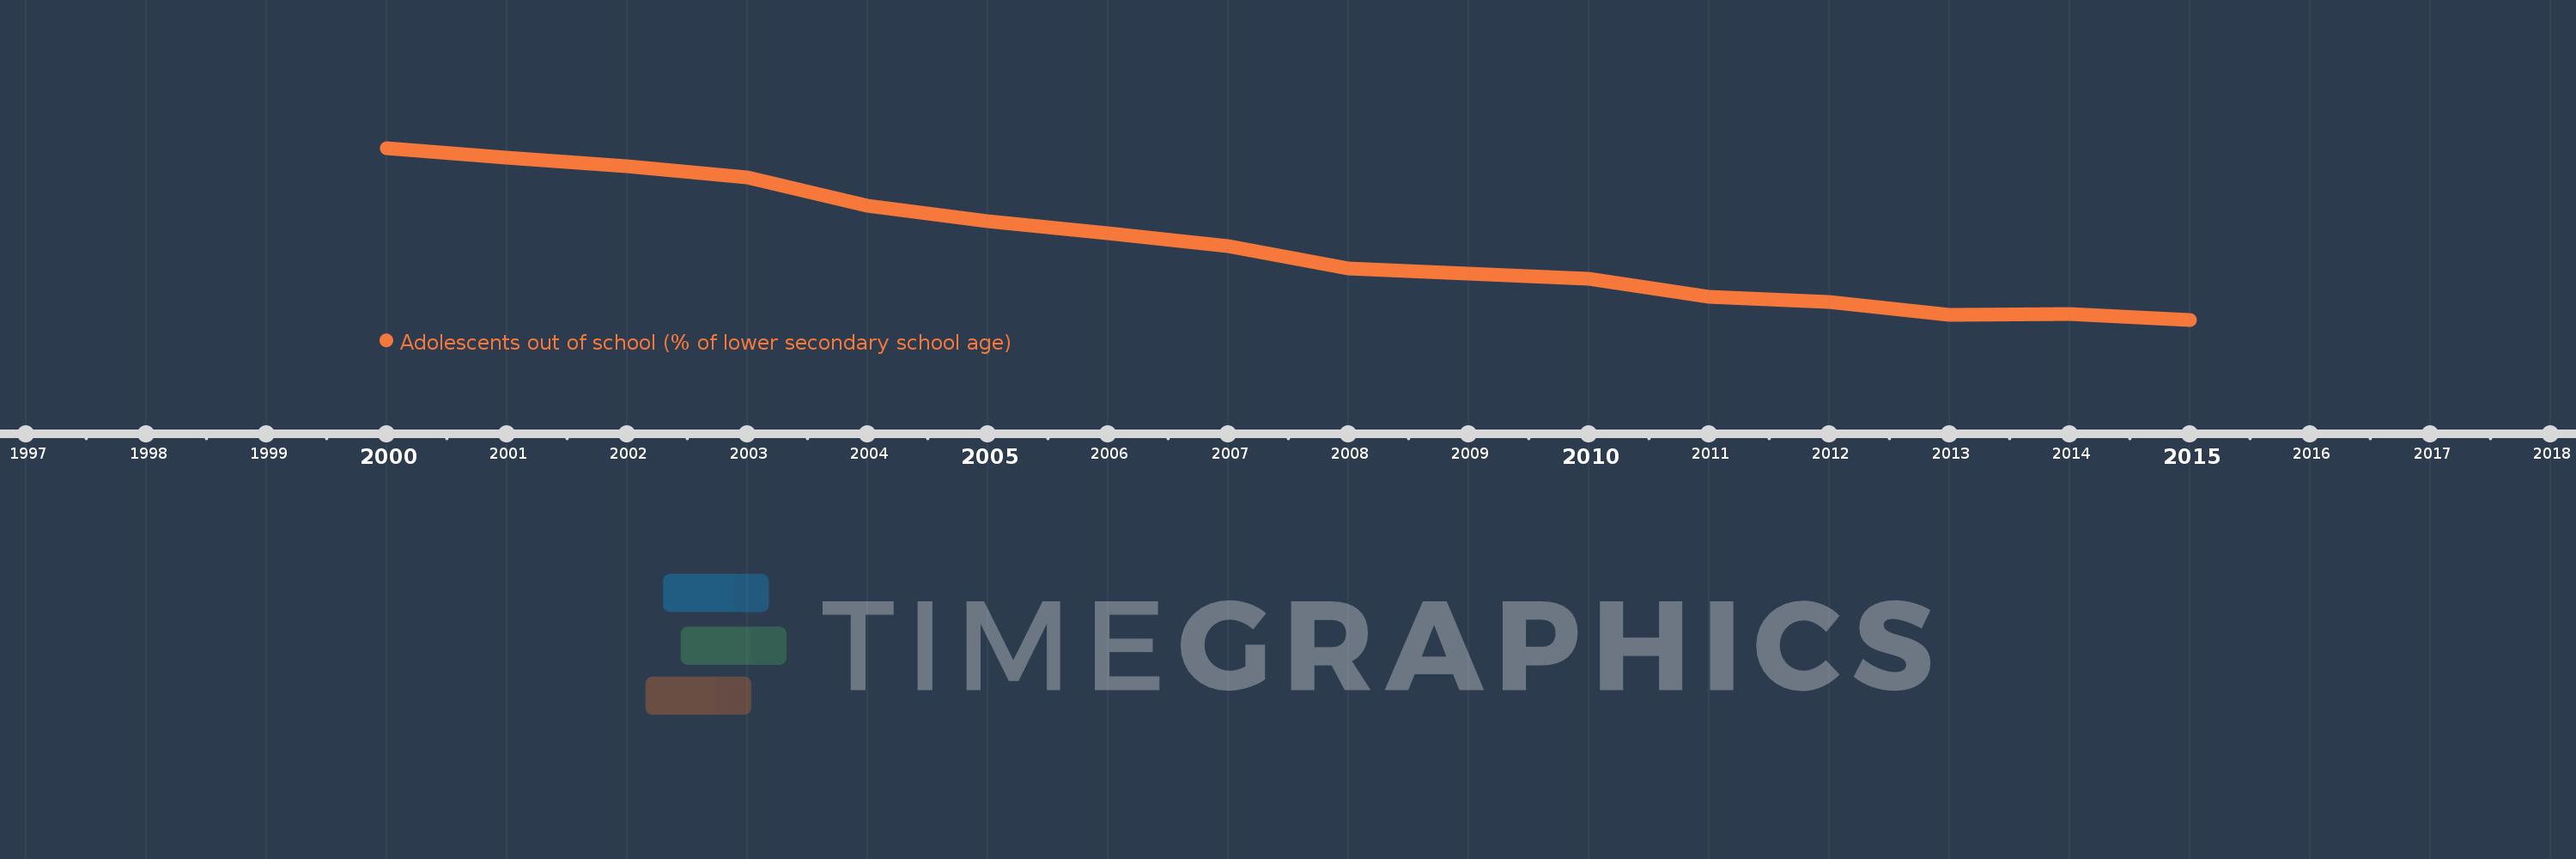
Questa scala temporale mostra un grafico dal 2000 anno al 2015 anno. Early-demographic dividend. I dati fino ad 1999 anno non disponibili. Il numero di osservazioni attuali secondo i date: 16.
La fonte (nome):
Indicatori dello sviluppo mondiale
La fonte (organizzazione):
United Nations Educational, Scientific, and Cultural Organization (UNESCO) Institute for Statistics.
Categorie:
Education
sono stati aggiornati
23 apr 2017 anni
Indicatori delle variazioni dei valori per anni
In media:
25.014
Minima:
17.677
1 gen 2015 anni
Massimo:
34.61
1 gen 2000 anni
Alla data di osservazione
Valore
Variazione assoluta
La variazione rispetto al valore precedente
1 gen 2000 anni
34.61
+34.61
0.0%
1 gen 2001 anni
33.658
-0.952
-2.75%
1 gen 2002 anni
32.765
-0.893
-2.65%
1 gen 2003 anni
31.697
-1.068
-3.26%
1 gen 2004 anni
28.945
-2.752
-8.68%
1 gen 2005 anni
27.378
-1.567
-5.41%
1 gen 2006 anni
26.194
-1.184
-4.32%
1 gen 2007 anni
24.906
-1.289
-4.92%
1 gen 2008 anni
22.762
-2.143
-8.61%
1 gen 2009 anni
22.192
-0.571
-2.51%
1 gen 2010 anni
21.684
-0.508
-2.29%
1 gen 2011 anni
19.906
-1.777
-8.2%
1 gen 2012 anni
19.448
-0.458
-2.3%
1 gen 2013 anni
18.194
-1.255
-6.45%
1 gen 2014 anni
18.216
+0.022
0.12%
1 gen 2015 anni
17.677
-0.539
-2.96%
Classificazione dei paesi secondo i statistiche attuali per anni