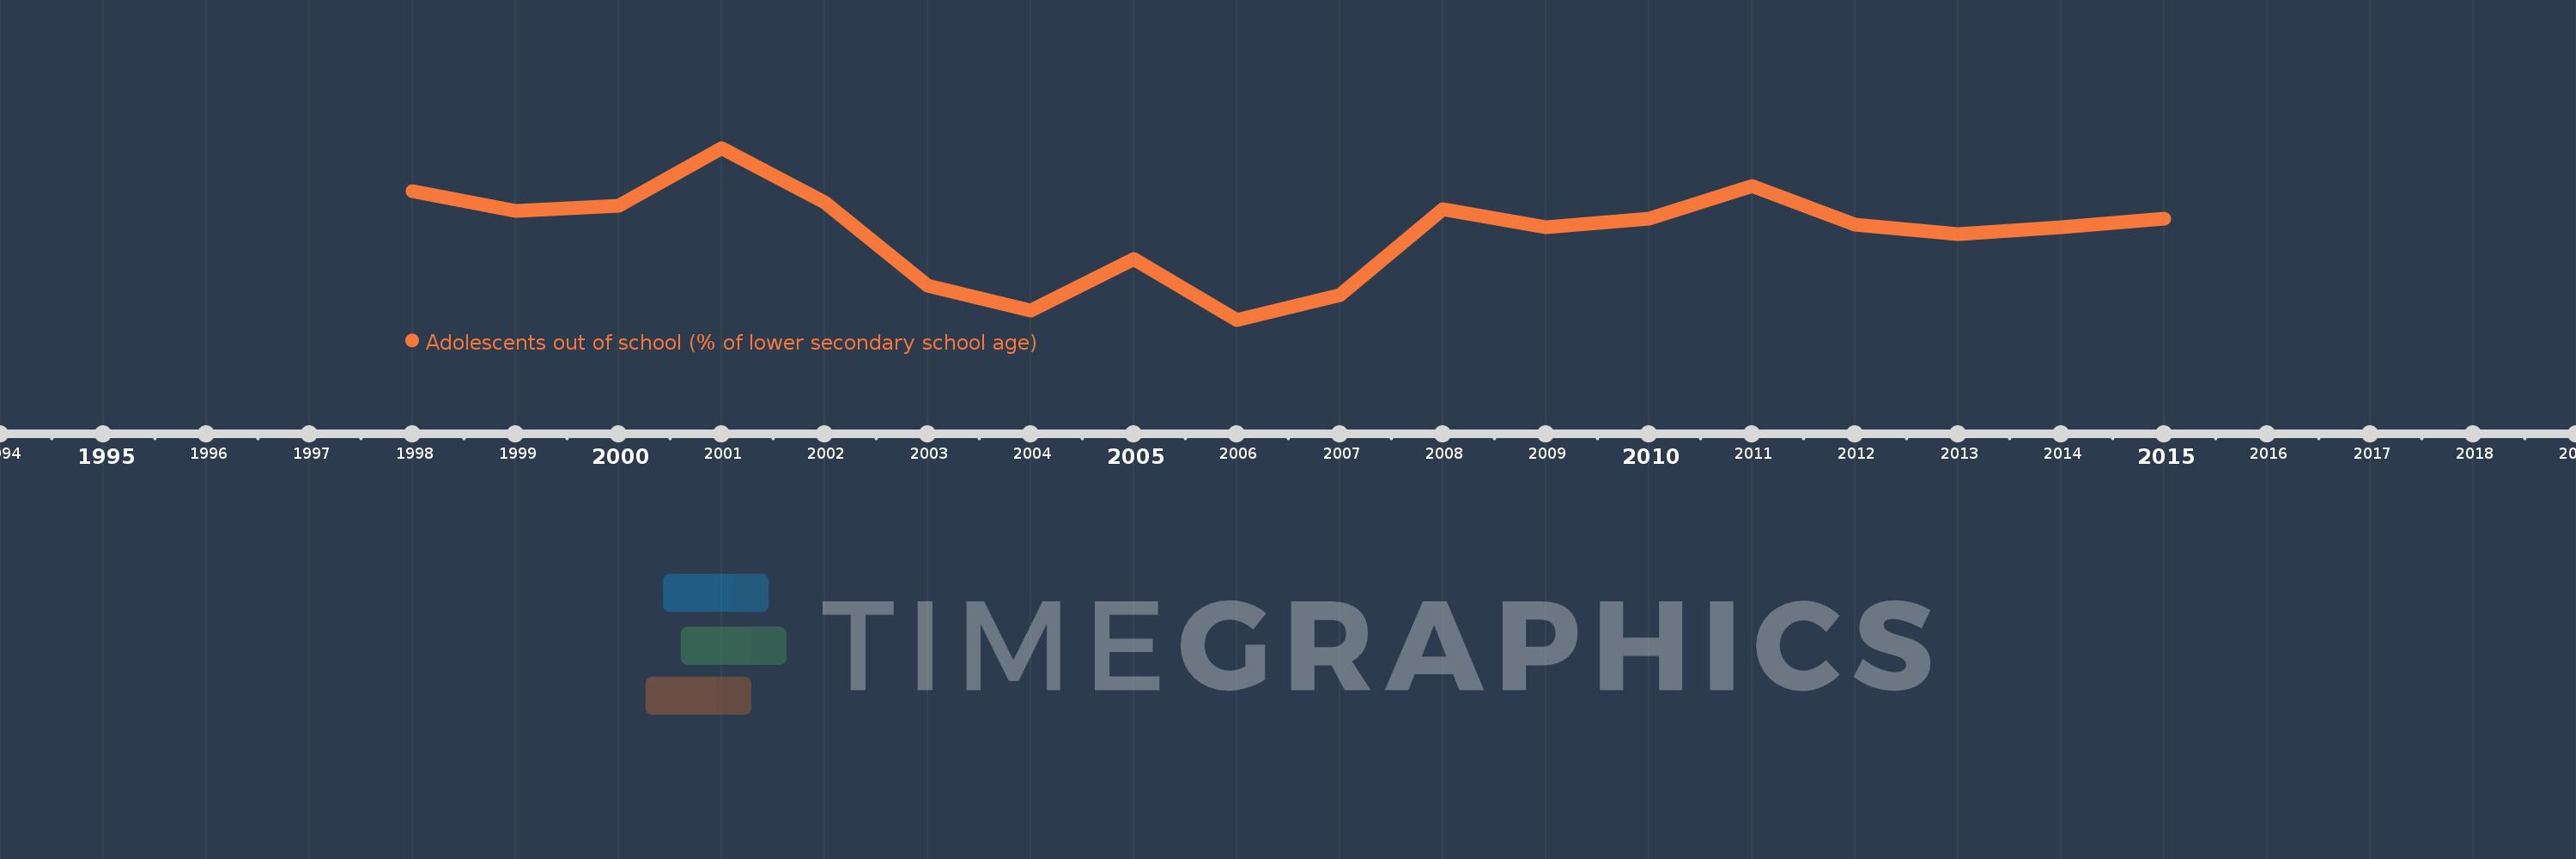
Questa scala temporale mostra un grafico dal 1998 anno al 2015 anno. Hungary. I dati fino ad 1997 anno non disponibili. Il numero di osservazioni attuali secondo i date: 18.
La fonte (nome):
Indicatori dello sviluppo mondiale
La fonte (organizzazione):
United Nations Educational, Scientific, and Cultural Organization (UNESCO) Institute for Statistics.
Categorie:
Education
sono stati aggiornati
23 apr 2017 anni
Indicatori delle variazioni dei valori per anni
In media:
1.211
Minima:
0.063
1 gen 2006 anni
Massimo:
2.309
1 gen 2001 anni
Alla data di osservazione
Valore
Variazione assoluta
La variazione rispetto al valore precedente
1 gen 1998 anni
1.742
+1.742
0.0%
1 gen 1999 anni
1.481
-0.26
-14.95%
1 gen 2000 anni
1.555
+0.073
4.96%
1 gen 2001 anni
2.309
+0.755
48.54%
1 gen 2002 anni
1.595
-0.715
-30.95%
1 gen 2003 anni
0.51
-1.084
-67.99%
1 gen 2004 anni
0.18
-0.331
-64.82%
1 gen 2005 anni
0.859
+0.679
378.27%
1 gen 2006 anni
0.063
-0.796
-92.65%
1 gen 2007 anni
0.385
+0.322
509.1%
1 gen 2008 anni
1.507
+1.122
291.74%
1 gen 2009 anni
1.267
-0.24
-15.91%
1 gen 2010 anni
1.38
+0.113
8.88%
1 gen 2011 anni
1.812
+0.432
31.3%
1 gen 2012 anni
1.302
-0.51
-28.14%
1 gen 2013 anni
1.179
-0.123
-9.47%
1 gen 2014 anni
1.277
+0.098
8.32%
1 gen 2015 anni
1.389
+0.113
8.84%
Classificazione dei paesi secondo i statistiche attuali per anni