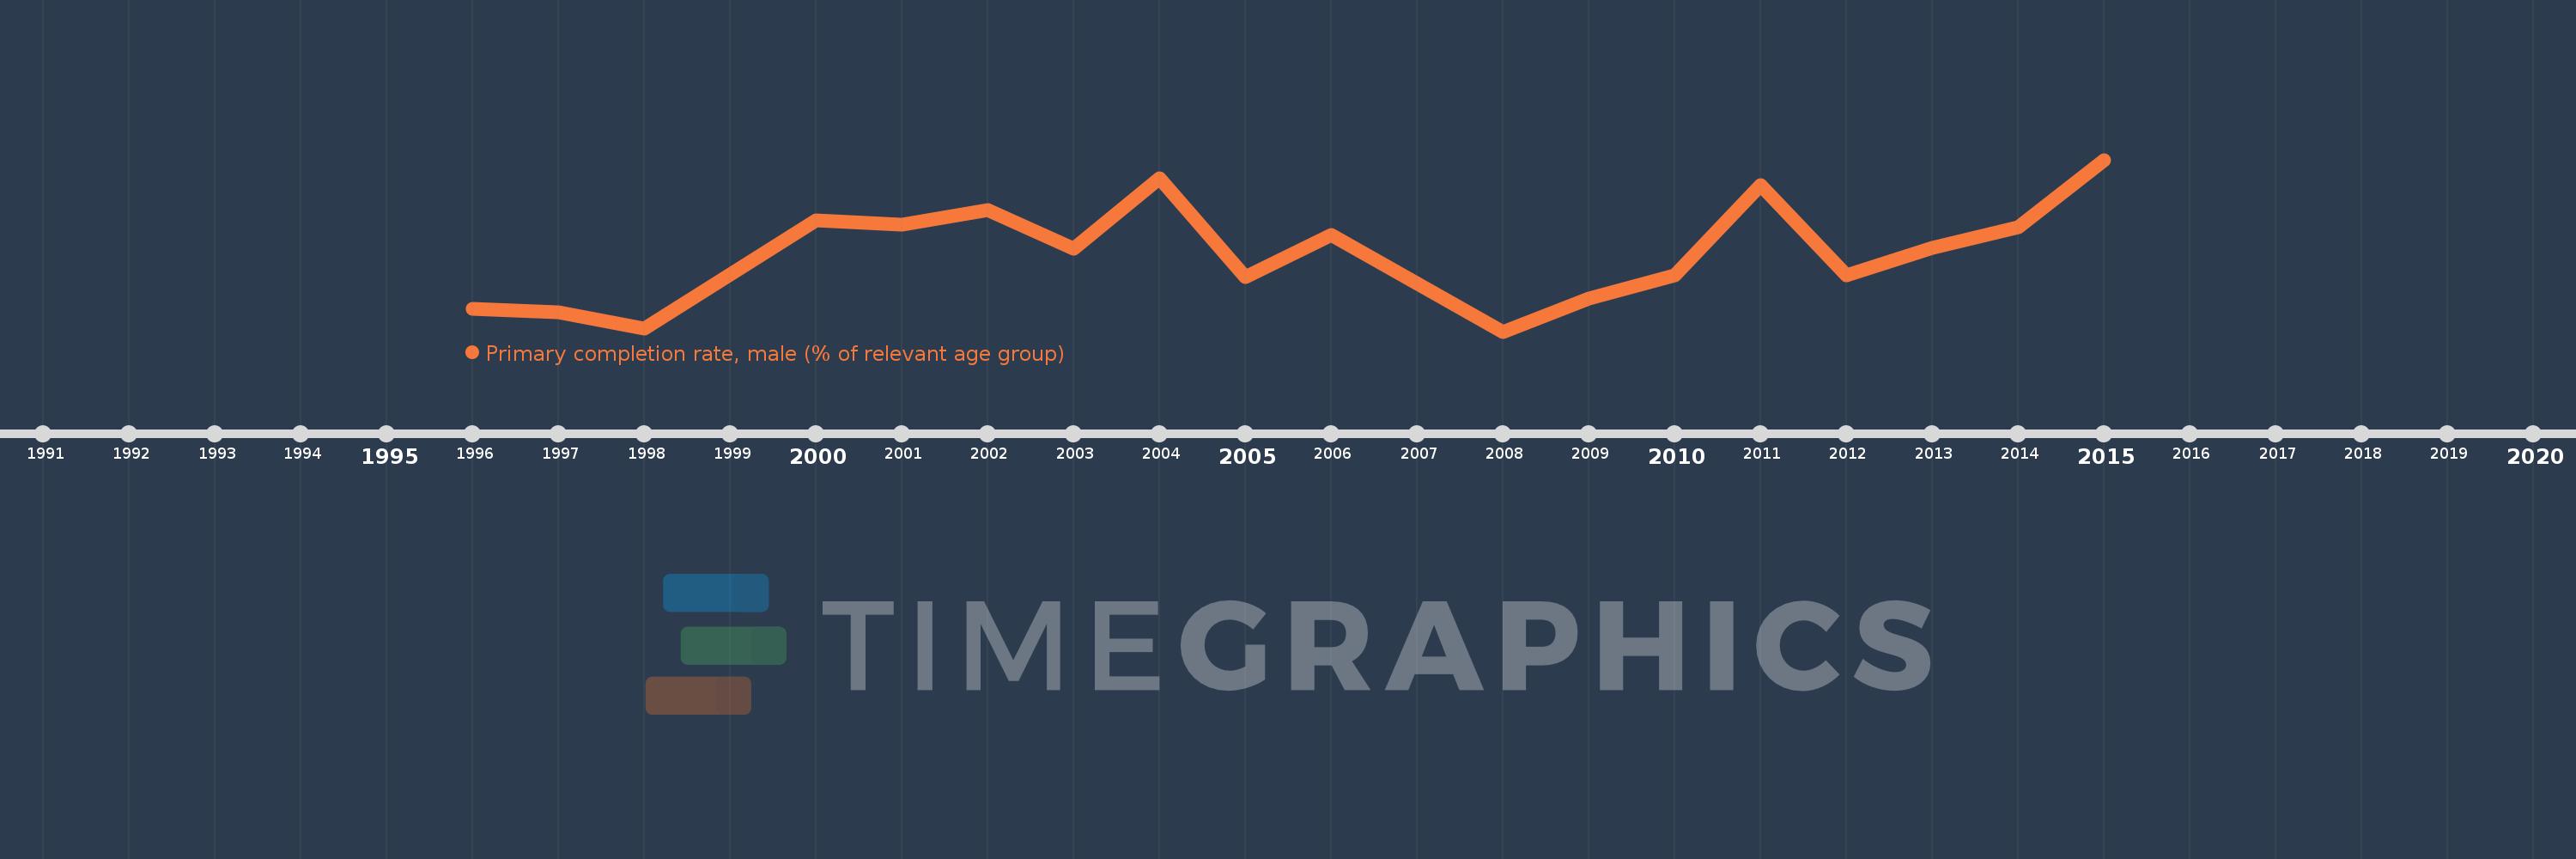
Questa scala temporale mostra un grafico dal 1996 anno al 2015 anno. West Bank and Gaza. I dati fino ad 1995 anno non disponibili. Il numero di osservazioni attuali secondo i date: 18.
La fonte (nome):
Indicatori dello sviluppo mondiale
La fonte (organizzazione):
United Nations Educational, Scientific, and Cultural Organization (UNESCO) Institute for Statistics.
Categorie:
Education, Gender
sono stati aggiornati
23 apr 2017 anni
Indicatori delle variazioni dei valori per anni
In media:
91.919
Minima:
86.118
1 gen 2008 anni
Massimo:
98.714
1 gen 2015 anni
Alla data di osservazione
Valore
Variazione assoluta
La variazione rispetto al valore precedente
1 gen 1996 anni
87.815
+87.815
0.0%
1 gen 1997 anni
87.528
-0.288
-0.33%
1 gen 1998 anni
86.338
-1.19
-1.36%
1 gen 2000 anni
94.292
+7.955
9.21%
1 gen 2001 anni
93.928
-0.364
-0.39%
1 gen 2002 anni
95.041
+1.112
1.18%
1 gen 2003 anni
92.221
-2.82
-2.97%
1 gen 2004 anni
97.332
+5.112
5.54%
1 gen 2005 anni
90.086
-7.246
-7.44%
1 gen 2006 anni
93.18
+3.094
3.43%
1 gen 2008 anni
86.118
-7.062
-7.58%
1 gen 2009 anni
88.562
+2.444
2.84%
1 gen 2010 anni
90.24
+1.678
1.9%
1 gen 2011 anni
96.884
+6.644
7.36%
1 gen 2012 anni
90.24
-6.644
-6.86%
1 gen 2013 anni
92.244
+2.004
2.22%
1 gen 2014 anni
93.786
+1.542
1.67%
1 gen 2015 anni
98.714
+4.928
5.25%
Classificazione dei paesi secondo i statistiche attuali per anni