33
/it/
AIzaSyB4mHJ5NPEv-XzF7P6NDYXjlkCWaeKw5bc
November 30, 2025
114205
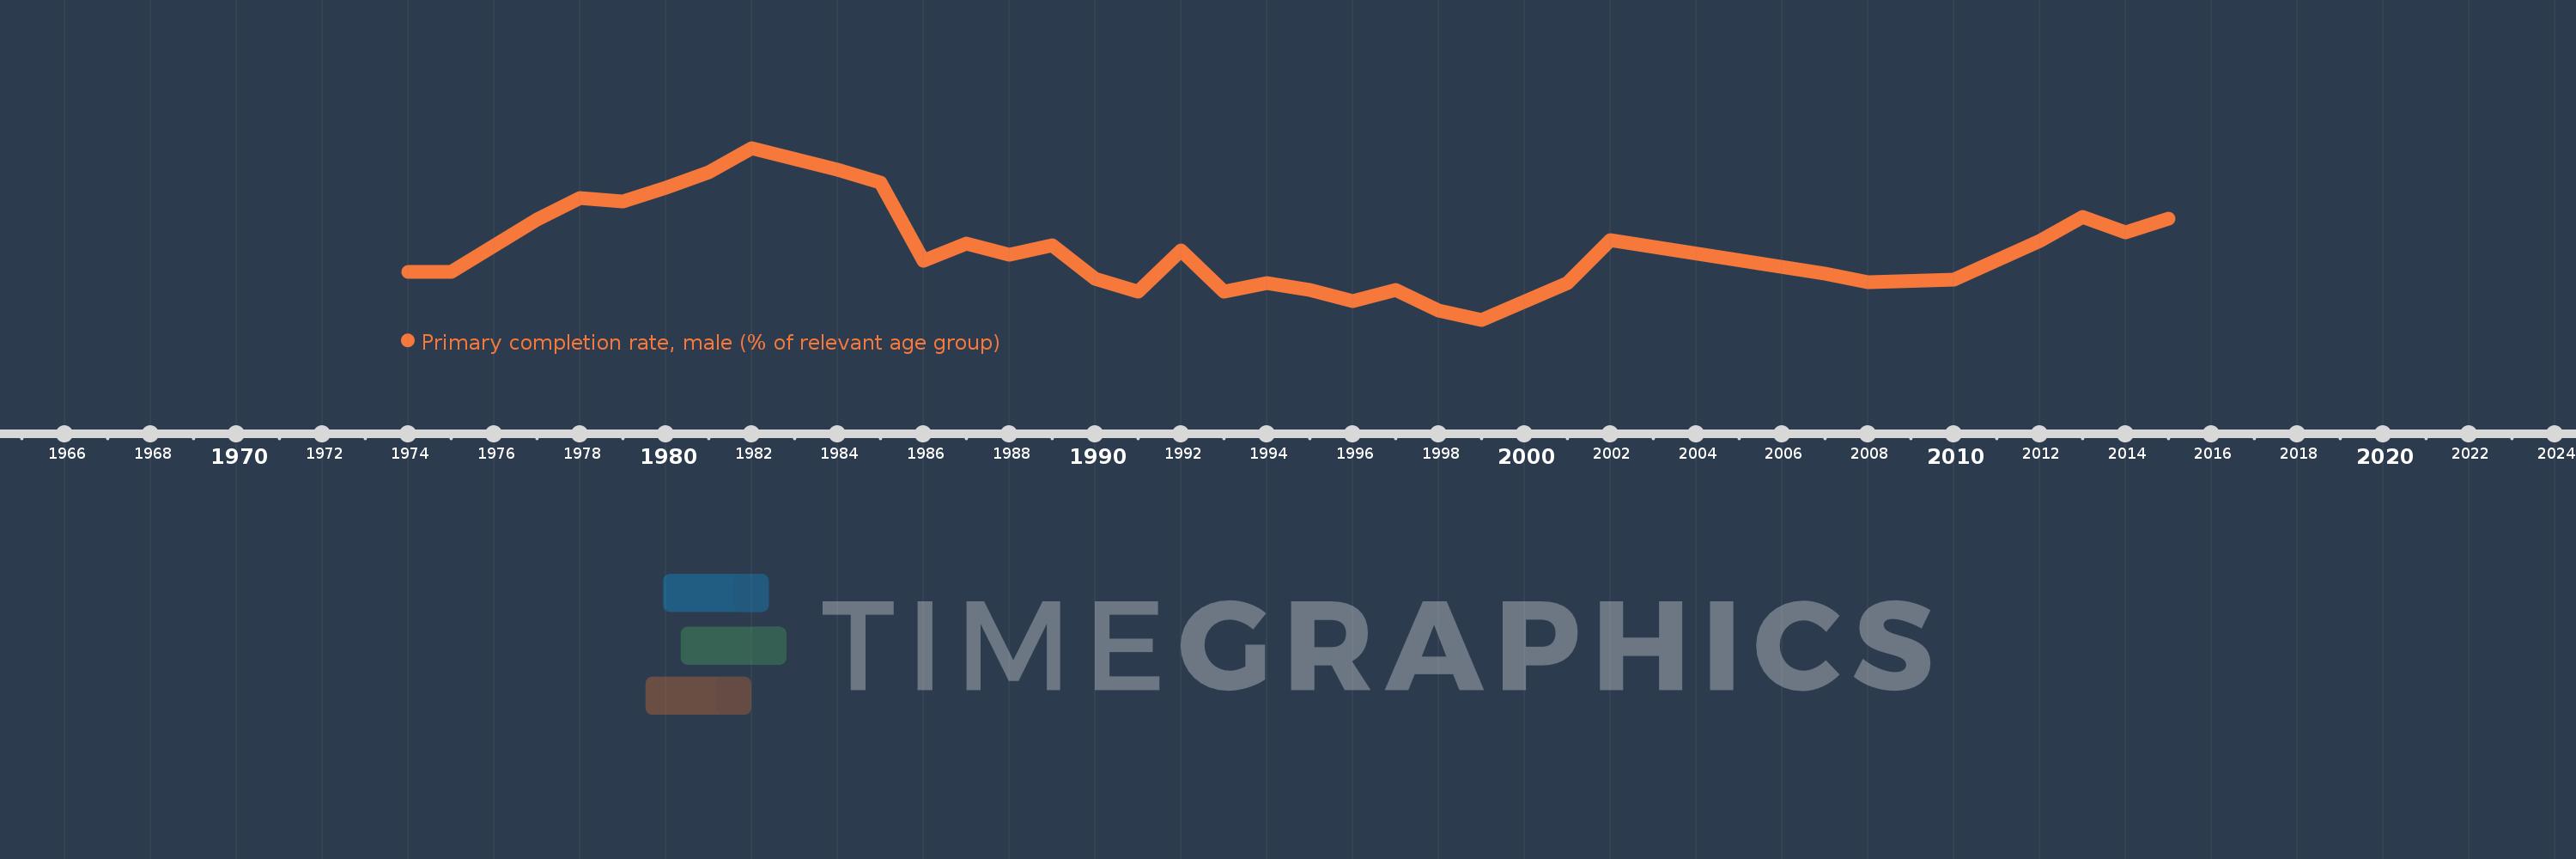
Cote d'Ivoire
CIV
true
2
1
Primary completion rate, male (% of relevant age group)
2015,2014,2013,2012,2010,2008,2007,2002,2001,1999,1998,1997,1996,1995,1994,1993,1992,1991,1990,1989,1988,1987,1986,1985,1984,1982,1981,1980,1979,1978,1977,1975,1974