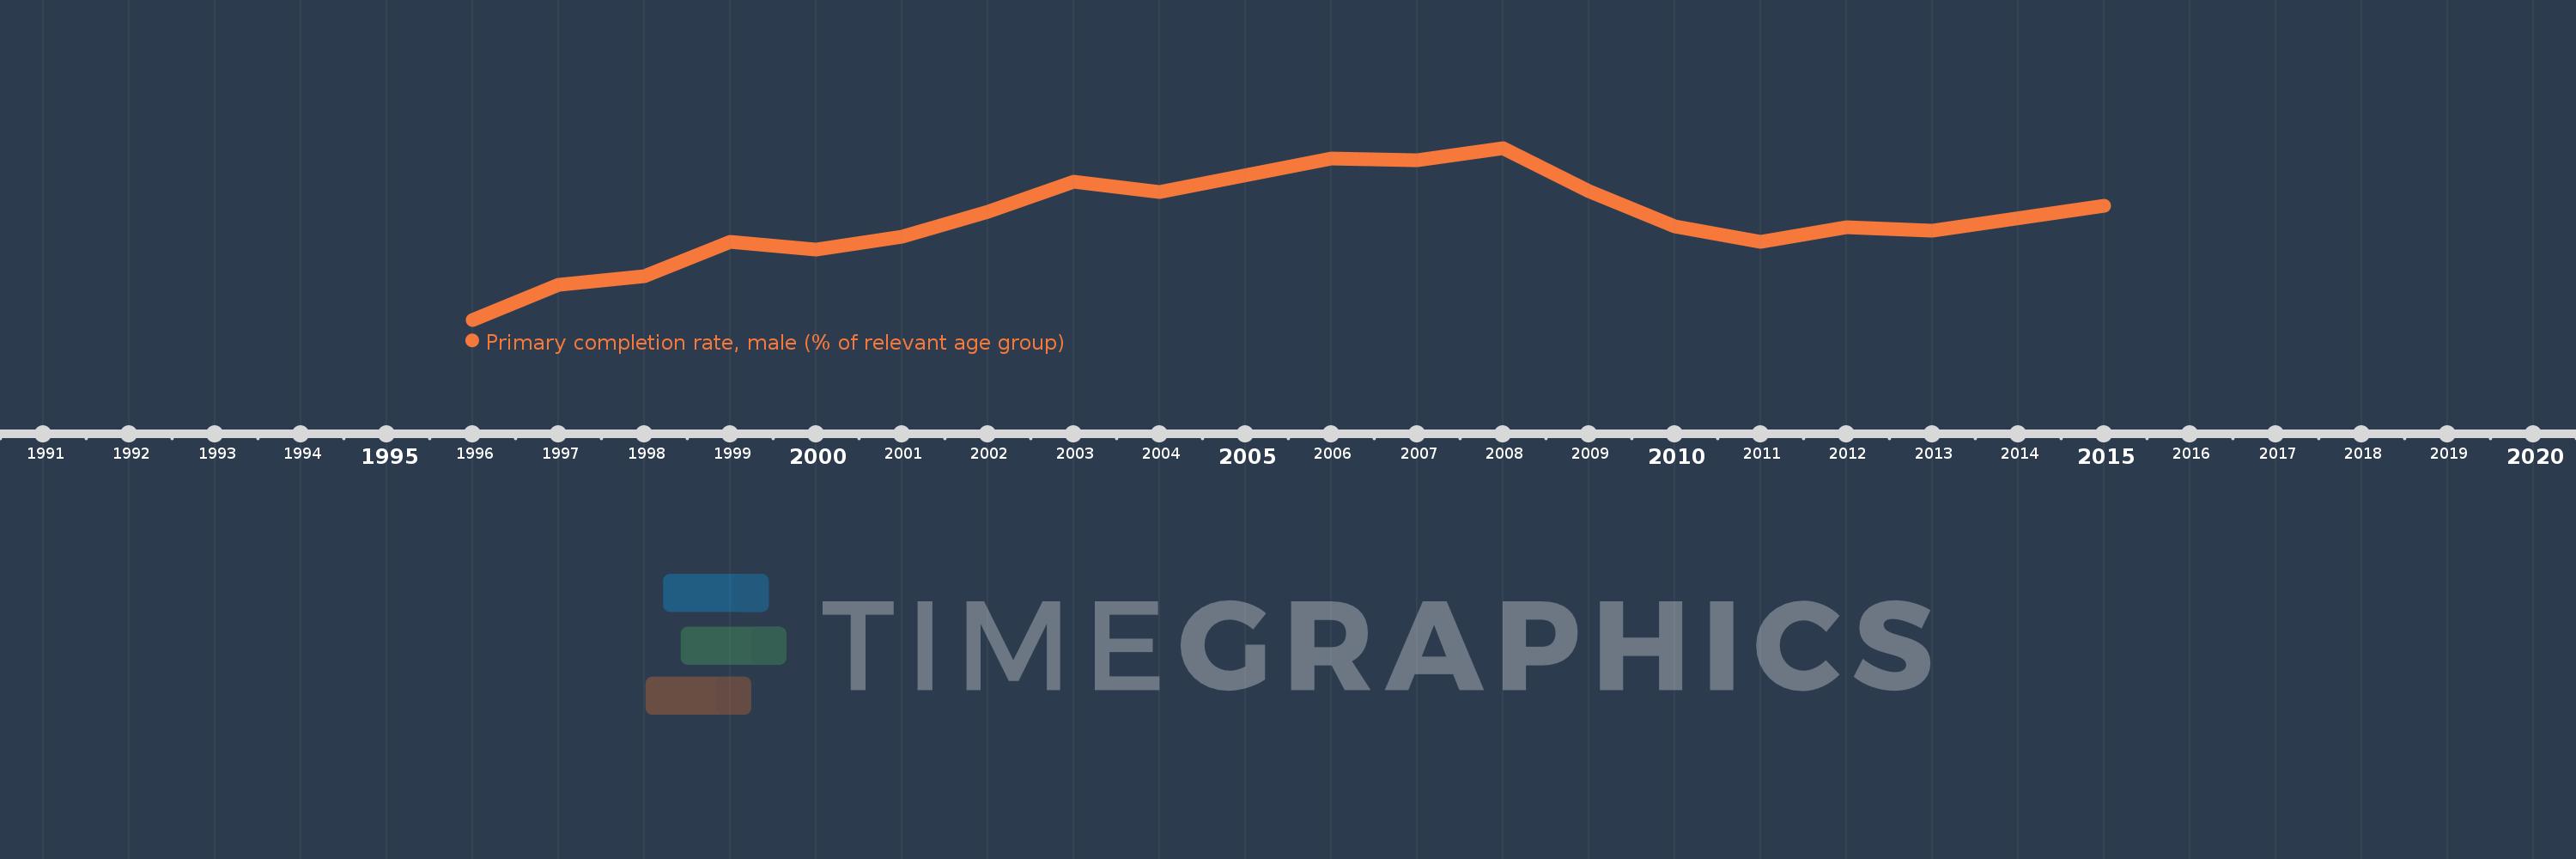
Questa scala temporale mostra un grafico dal 1996 anno al 2015 anno. Croatia. I dati fino ad 1995 anno non disponibili. Il numero di osservazioni attuali secondo i date: 18.
La fonte (nome):
Indicatori dello sviluppo mondiale
La fonte (organizzazione):
United Nations Educational, Scientific, and Cultural Organization (UNESCO) Institute for Statistics.
Categorie:
Education, Gender
sono stati aggiornati
23 apr 2017 anni
Indicatori delle variazioni dei valori per anni
In media:
93.728
Minima:
79.874
1 gen 1996 anni
Massimo:
104.061
1 gen 2008 anni
Alla data di osservazione
Valore
Variazione assoluta
La variazione rispetto al valore precedente
1 gen 1996 anni
79.874
+79.874
0.0%
1 gen 1997 anni
84.829
+4.955
6.2%
1 gen 1998 anni
85.963
+1.134
1.34%
1 gen 1999 anni
90.813
+4.85
5.64%
1 gen 2000 anni
89.731
-1.083
-1.19%
1 gen 2001 anni
91.518
+1.787
1.99%
1 gen 2002 anni
95.056
+3.539
3.87%
1 gen 2003 anni
99.335
+4.279
4.5%
1 gen 2004 anni
97.806
-1.529
-1.54%
1 gen 2006 anni
102.631
+4.825
4.93%
1 gen 2007 anni
102.295
-0.336
-0.33%
1 gen 2008 anni
104.061
+1.765
1.73%
1 gen 2009 anni
98.011
-6.05
-5.81%
1 gen 2010 anni
93.076
-4.935
-5.03%
1 gen 2011 anni
90.894
-2.182
-2.34%
1 gen 2012 anni
92.948
+2.054
2.26%
1 gen 2013 anni
92.383
-0.566
-0.61%
1 gen 2015 anni
95.876
+3.493
3.78%
Classificazione dei paesi secondo i statistiche attuali per anni