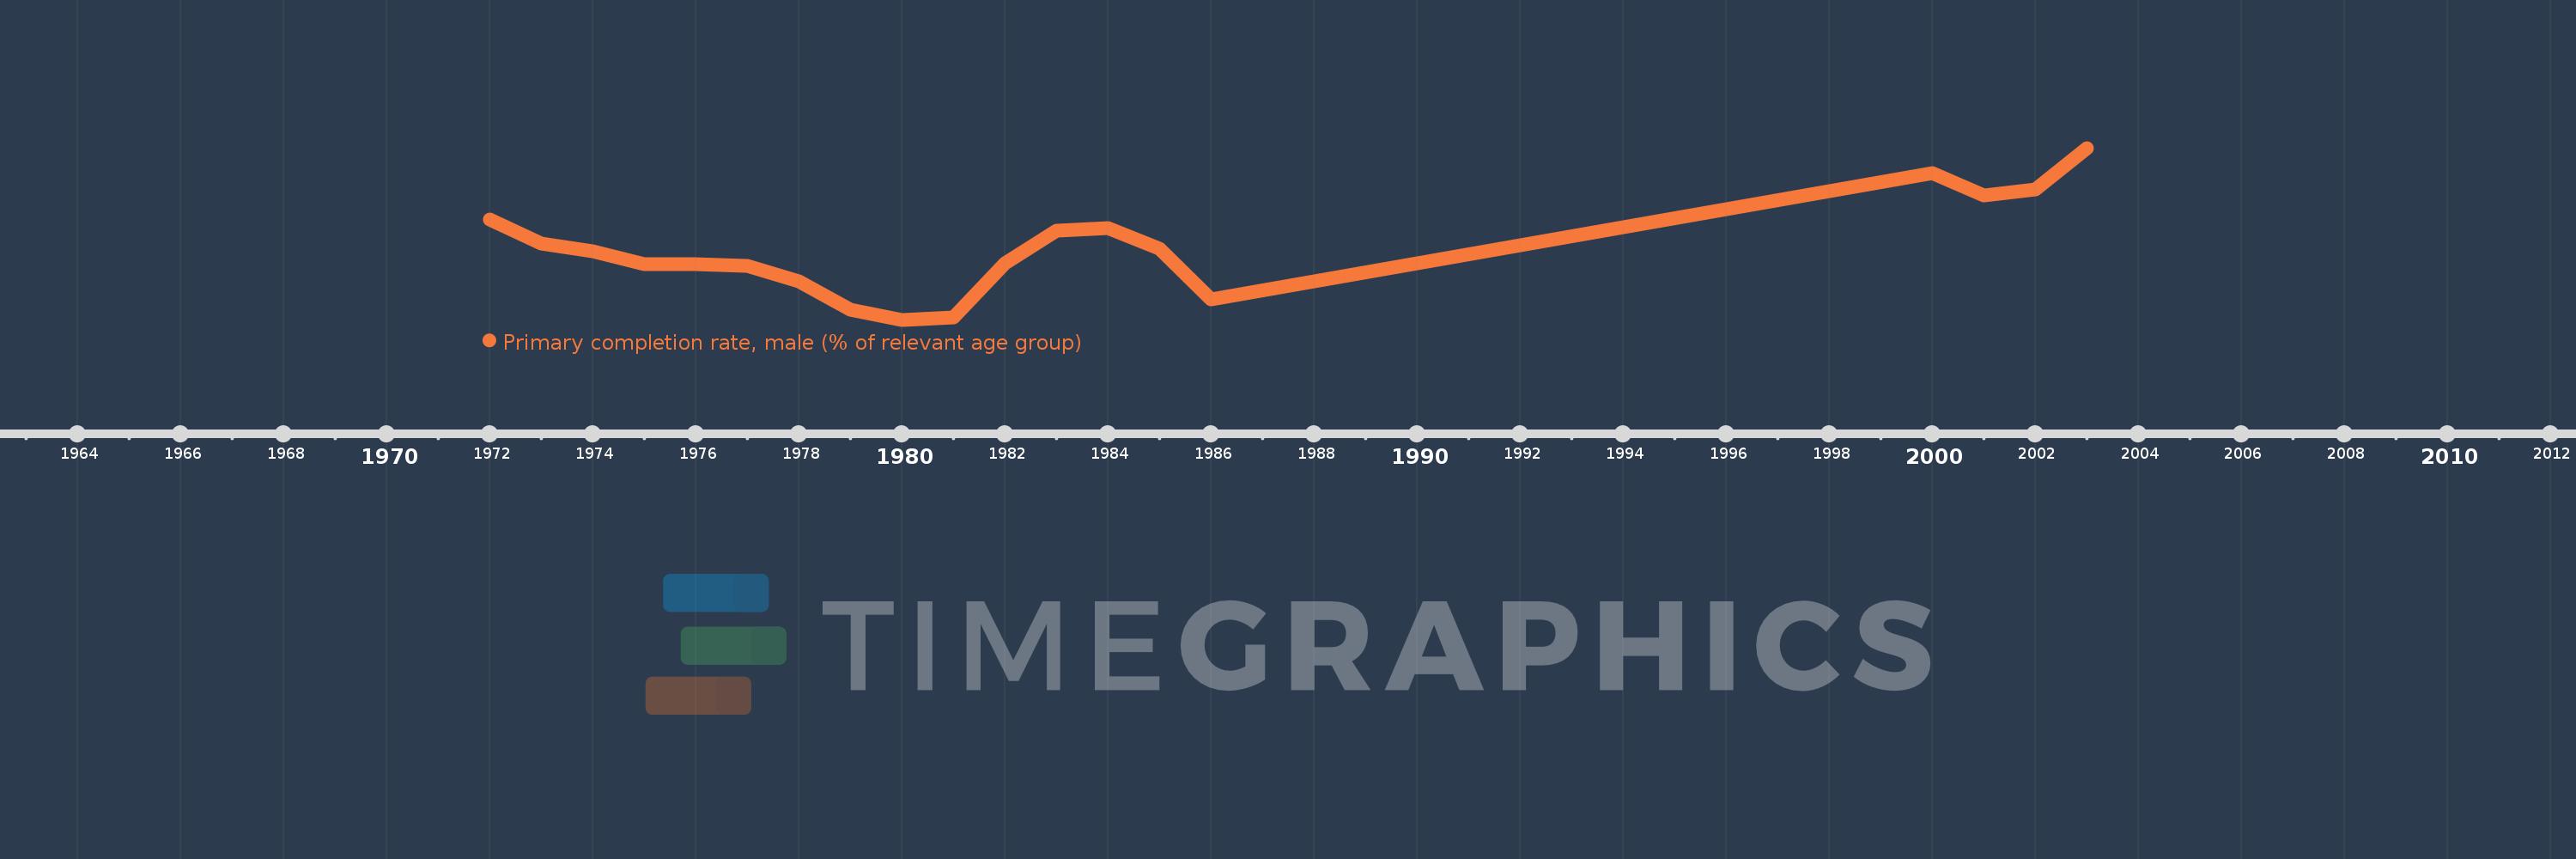
Questa scala temporale mostra un grafico dal 1972 anno al 2003 anno. Netherlands. I dati fino ad 1971 anno non disponibili. Il numero di osservazioni attuali secondo i date: 19.
La fonte (nome):
Indicatori dello sviluppo mondiale
La fonte (organizzazione):
United Nations Educational, Scientific, and Cultural Organization (UNESCO) Institute for Statistics.
Categorie:
Education, Gender
sono stati aggiornati
23 apr 2017 anni
Indicatori delle variazioni dei valori per anni
In media:
94.385
Minima:
88.9
1 gen 1980 anni
Massimo:
102.055
1 gen 2003 anni
Alla data di osservazione
Valore
Variazione assoluta
La variazione rispetto al valore precedente
1 gen 1972 anni
96.553
+96.553
0.0%
1 gen 1973 anni
94.743
-1.81
-1.88%
1 gen 1974 anni
94.158
-0.584
-0.62%
1 gen 1975 anni
93.167
-0.991
-1.05%
1 gen 1976 anni
93.146
-0.021
-0.02%
1 gen 1977 anni
93.017
-0.129
-0.14%
1 gen 1978 anni
91.822
-1.195
-1.28%
1 gen 1979 anni
89.656
-2.166
-2.36%
1 gen 1980 anni
88.9
-0.756
-0.84%
1 gen 1981 anni
89.049
+0.149
0.17%
1 gen 1982 anni
93.232
+4.183
4.7%
1 gen 1983 anni
95.75
+2.518
2.7%
1 gen 1984 anni
95.915
+0.165
0.17%
1 gen 1985 anni
94.311
-1.604
-1.67%
1 gen 1986 anni
90.449
-3.862
-4.09%
1 gen 2000 anni
100.109
+9.66
10.68%
1 gen 2001 anni
98.406
-1.704
-1.7%
1 gen 2002 anni
98.868
+0.463
0.47%
1 gen 2003 anni
102.055
+3.186
3.22%
Classificazione dei paesi secondo i statistiche attuali per anni