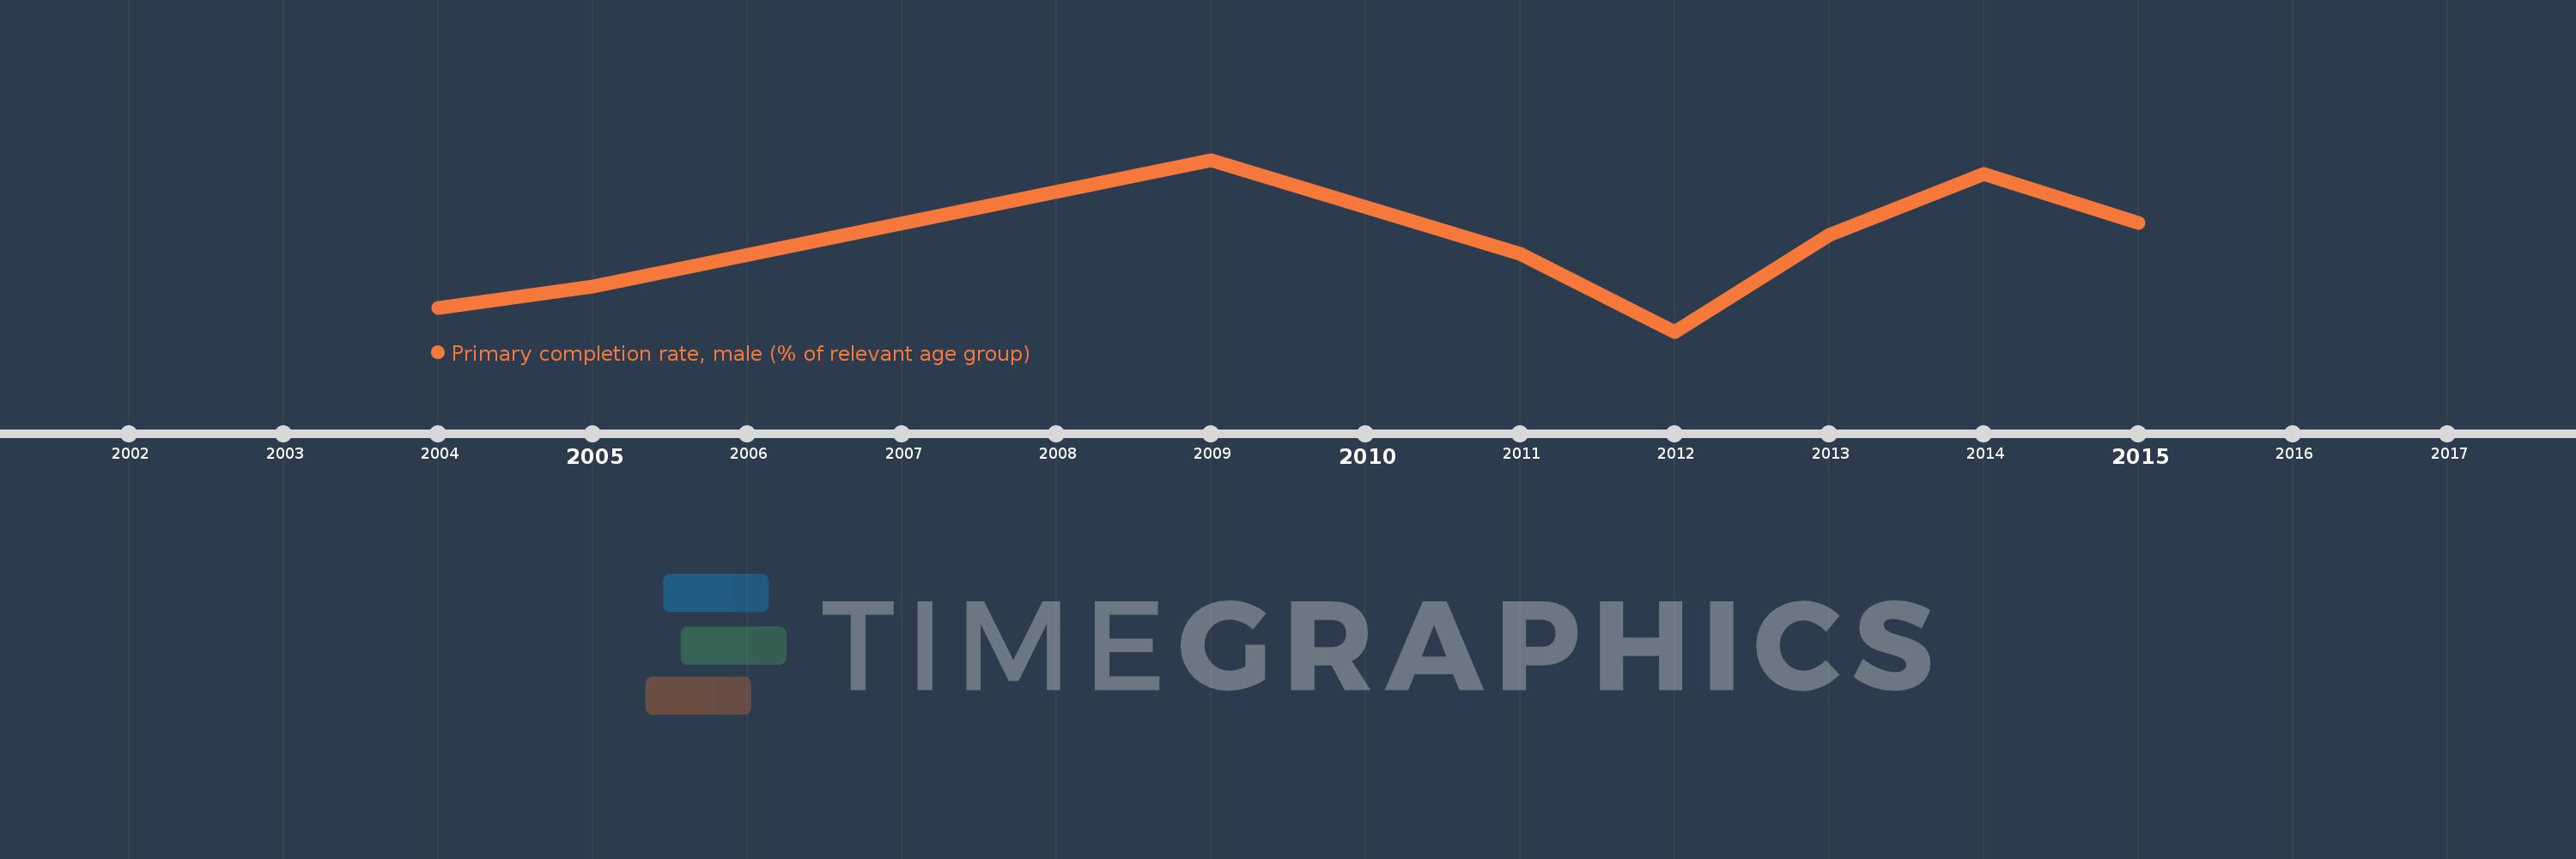
Questa scala temporale mostra un grafico dal 2004 anno al 2015 anno. St. Vincent and the Grenadines. I dati fino ad 2003 anno non disponibili. Il numero di osservazioni attuali secondo i date: 8.
La fonte (nome):
Indicatori dello sviluppo mondiale
La fonte (organizzazione):
United Nations Educational, Scientific, and Cultural Organization (UNESCO) Institute for Statistics.
Categorie:
Education, Gender
sono stati aggiornati
23 apr 2017 anni
Indicatori delle variazioni dei valori per anni
In media:
97.919
Minima:
82.188
1 gen 2012 anni
Massimo:
113.928
1 gen 2009 anni
Alla data di osservazione
Valore
Variazione assoluta
La variazione rispetto al valore precedente
1 gen 2004 anni
86.52
+86.52
0.0%
1 gen 2005 anni
90.489
+3.969
4.59%
1 gen 2009 anni
113.928
+23.439
25.9%
1 gen 2011 anni
96.588
-17.34
-15.22%
1 gen 2012 anni
82.188
-14.4
-14.91%
1 gen 2013 anni
100.1
+17.912
21.79%
1 gen 2014 anni
111.329
+11.228
11.22%
1 gen 2015 anni
102.215
-9.113
-8.19%
Classificazione dei paesi secondo i statistiche attuali per anni