33
/fr/
AIzaSyAYiBZKx7MnpbEhh9jyipgxe19OcubqV5w
August 1, 2025
98572
Cambodia
KHM
true
2
1
Foreign direct investment, net (BoP, current US$)
2015,2014,2013,2012,2011,2010,2009,2008,2007,2006,2005,2004,2003,2002,2001,2000,1999,1998,1997,1996,1995,1994,1993
Download
Bibliothèque de statistiques globales →Cambodia →

Foreign direct investment, net (BoP, current US$)

Cette statistique dans les autres pays:

AfghanistanAlbaniaAlgeriaAngolaAntigua and BarbudaArgentinaArmeniaArubaAustraliaAustriaAzerbaijanBahamas, TheBahrainBangladeshBarbadosBelarusBelgiumBelizeBeninBermudaBhutanBoliviaBosnia and HerzegovinaBotswanaBrazilBrunei DarussalamBulgariaBurkina FasoBurundiCabo VerdeCambodiaCameroonCanadaCentral African RepublicChadChileChinaColombiaComorosCongo, Dem. Rep.Congo, Rep.Costa RicaCote d'IvoireCroatiaCuracaoCyprusCzech RepublicDenmarkDjiboutiDominicaDominican RepublicEcuadorEgypt, Arab Rep.El SalvadorEquatorial GuineaEritreaEstoniaEthiopiaEuro areaFijiFinlandFranceFrench PolynesiaGabonGambia, TheGeorgiaGermanyGhanaGreeceGrenadaGuatemalaGuineaGuinea-BissauGuyanaHaitiHondurasHong Kong SAR, ChinaHungaryIcelandIndiaIndonesiaIran, Islamic Rep.IraqIrelandIsraelItalyJamaicaJapanJordanKazakhstanKenyaKiribatiKorea, Rep.KosovoKuwaitKyrgyz RepublicLao PDRLatviaLebanonLesothoLiberiaLibyaLithuaniaLuxembourgMacao SAR, ChinaMacedonia, FYRMadagascarMalawiMalaysiaMaldivesMaliMaltaMarshall IslandsMauritaniaMauritiusMexicoMicronesia, Fed. Sts.MoldovaMongoliaMontenegroMoroccoMozambiqueMyanmarNamibiaNepalNetherlandsNew CaledoniaNew ZealandNicaraguaNigerNigeriaNorwayOmanPakistanPalauPanamaPapua New GuineaParaguayPeruPhilippinesPolandPortugalQatarRomaniaRussian FederationRwandaSamoaSao Tome and PrincipeSaudi ArabiaSenegalSerbiaSeychellesSierra LeoneSingaporeSint Maarten (Dutch part)Slovak RepublicSloveniaSolomon IslandsSouth AfricaSouth SudanSpainSri LankaSt. Kitts and NevisSt. LuciaSt. Vincent and the GrenadinesSudanSurinameSwazilandSwedenSwitzerlandSyrian Arab RepublicTajikistanTanzaniaThailandTimor-LesteTogoTongaTrinidad and TobagoTunisiaTurkeyTuvaluUgandaUkraineUnited KingdomUnited StatesUruguayVanuatuVenezuela, RBVietnamWest Bank and GazaYemen, Rep.ZambiaZimbabwe

La ligne de temps

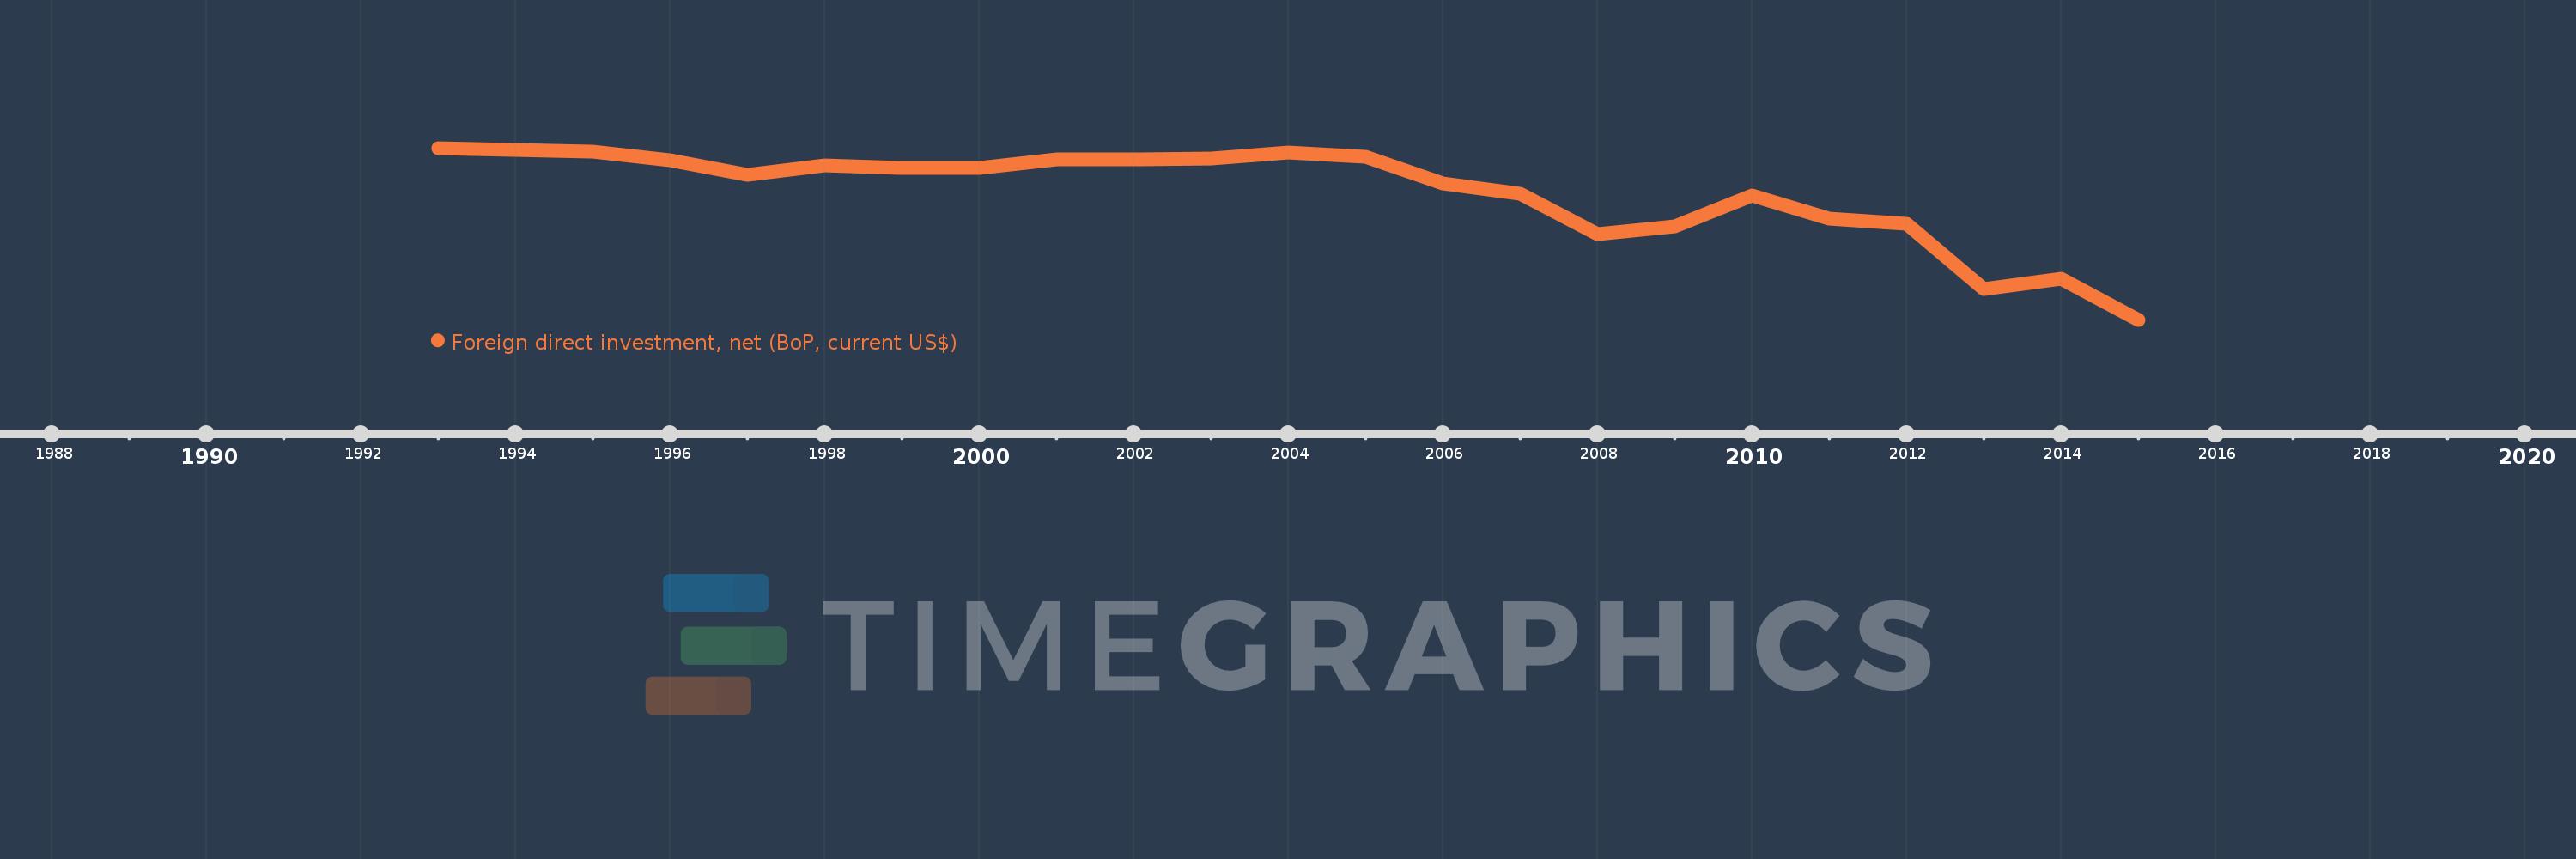
Cette échelle de temps montre un graphique de 1993 année à 2015 année Cambodia. Les données jusqu'à 1992 année ne sont pas présentés. Quantité d'observations actuelles selon dates: 23.

Source (désignation):

Les indicateurs du développement mondiale

Source (organisation):

International Monetary Fund, Balance of Payments Statistics Yearbook and data files.

Catégories:

Economy & Growth, Financial Sector

Dernière mise à jour

23 avr. 2017

Les indicateurs de changement de valeurs selon les années

En moyenne:
-467.508 mln.
Minimum:
-1.698 mds
1 janv. 2015
Maximum:
-33.0 mln.
1 janv. 1993
Pour la date d''observation
Valeur
Changement absolu
Le changement par rapport à la valeur précédente
1 janv. 1993
-33.0 mln.
-33.0 mln.
0.0%
1 janv. 1994
-54.124 mln.
-21.124 mln.
64.01%
1 janv. 1995
-68.9 mln.
-14.776 mln.
27.3%
1 janv. 1996
-150.8 mln.
-81.9 mln.
118.87%
1 janv. 1997
-293.6 mln.
-142.8 mln.
94.69%
1 janv. 1998
-203.7 mln.
+89.9 mln.
-30.62%
1 janv. 1999
-223.03 mln.
-19.33 mln.
9.49%
1 janv. 2000
-223.147 mln.
-116.747 milles
0.05%
1 janv. 2001
-141.911 mln.
+81.236 mln.
-36.4%
1 janv. 2002
-142.109 mln.
-198.929 milles
0.14%
1 janv. 2003
-139.08 mln.
+3.029 mln.
-2.13%
1 janv. 2004
-74.32 mln.
+64.761 mln.
-46.56%
1 janv. 2005
-121.173 mln.
-46.854 mln.
63.04%
1 janv. 2006
-372.902 mln.
-251.729 mln.
207.74%
1 janv. 2007
-474.828 mln.
-101.925 mln.
27.33%
1 janv. 2008
-866.193 mln.
-391.366 mln.
82.42%
1 janv. 2009
-794.691 mln.
+71.502 mln.
-8.25%
1 janv. 2010
-492.241 mln.
+302.45 mln.
-38.06%
1 janv. 2011
-714.619 mln.
-222.378 mln.
45.18%
1 janv. 2012
-766.295 mln.
-51.676 mln.
7.23%
1 janv. 2013
-1.405 mds
-638.502 mln.
83.32%
1 janv. 2014
-1.299 mds
+106.007 mln.
-7.55%
1 janv. 2015
-1.698 mds
-399.645 mln.
30.77%

Classement des pays selon les statistiques actuelles par années