30
/fr/
AIzaSyAYiBZKx7MnpbEhh9jyipgxe19OcubqV5w
April 1, 2024
197530
Moldova
MDA
true
2
1
Foreign direct investment, net (BoP, current US$)
2016,2015,2014,2013,2012,2011,2010,2009,2008,2007,2006,2005,2004,2003,2002,2001,2000,1999,1998,1997,1996,1995
Download
Bibliothèque de statistiques globales →Moldova →

Foreign direct investment, net (BoP, current US$)

Cette statistique dans les autres pays:

AfghanistanAlbaniaAlgeriaAngolaAntigua and BarbudaArgentinaArmeniaArubaAustraliaAustriaAzerbaijanBahamas, TheBahrainBangladeshBarbadosBelarusBelgiumBelizeBeninBermudaBhutanBoliviaBosnia and HerzegovinaBotswanaBrazilBrunei DarussalamBulgariaBurkina FasoBurundiCabo VerdeCambodiaCameroonCanadaCentral African RepublicChadChileChinaColombiaComorosCongo, Dem. Rep.Congo, Rep.Costa RicaCote d'IvoireCroatiaCuracaoCyprusCzech RepublicDenmarkDjiboutiDominicaDominican RepublicEcuadorEgypt, Arab Rep.El SalvadorEquatorial GuineaEritreaEstoniaEthiopiaEuro areaFijiFinlandFranceFrench PolynesiaGabonGambia, TheGeorgiaGermanyGhanaGreeceGrenadaGuatemalaGuineaGuinea-BissauGuyanaHaitiHondurasHong Kong SAR, ChinaHungaryIcelandIndiaIndonesiaIran, Islamic Rep.IraqIrelandIsraelItalyJamaicaJapanJordanKazakhstanKenyaKiribatiKorea, Rep.KosovoKuwaitKyrgyz RepublicLao PDRLatviaLebanonLesothoLiberiaLibyaLithuaniaLuxembourgMacao SAR, ChinaMacedonia, FYRMadagascarMalawiMalaysiaMaldivesMaliMaltaMarshall IslandsMauritaniaMauritiusMexicoMicronesia, Fed. Sts.MoldovaMongoliaMontenegroMoroccoMozambiqueMyanmarNamibiaNepalNetherlandsNew CaledoniaNew ZealandNicaraguaNigerNigeriaNorwayOmanPakistanPalauPanamaPapua New GuineaParaguayPeruPhilippinesPolandPortugalQatarRomaniaRussian FederationRwandaSamoaSao Tome and PrincipeSaudi ArabiaSenegalSerbiaSeychellesSierra LeoneSingaporeSint Maarten (Dutch part)Slovak RepublicSloveniaSolomon IslandsSouth AfricaSouth SudanSpainSri LankaSt. Kitts and NevisSt. LuciaSt. Vincent and the GrenadinesSudanSurinameSwazilandSwedenSwitzerlandSyrian Arab RepublicTajikistanTanzaniaThailandTimor-LesteTogoTongaTrinidad and TobagoTunisiaTurkeyTuvaluUgandaUkraineUnited KingdomUnited StatesUruguayVanuatuVenezuela, RBVietnamWest Bank and GazaYemen, Rep.ZambiaZimbabwe

La ligne de temps

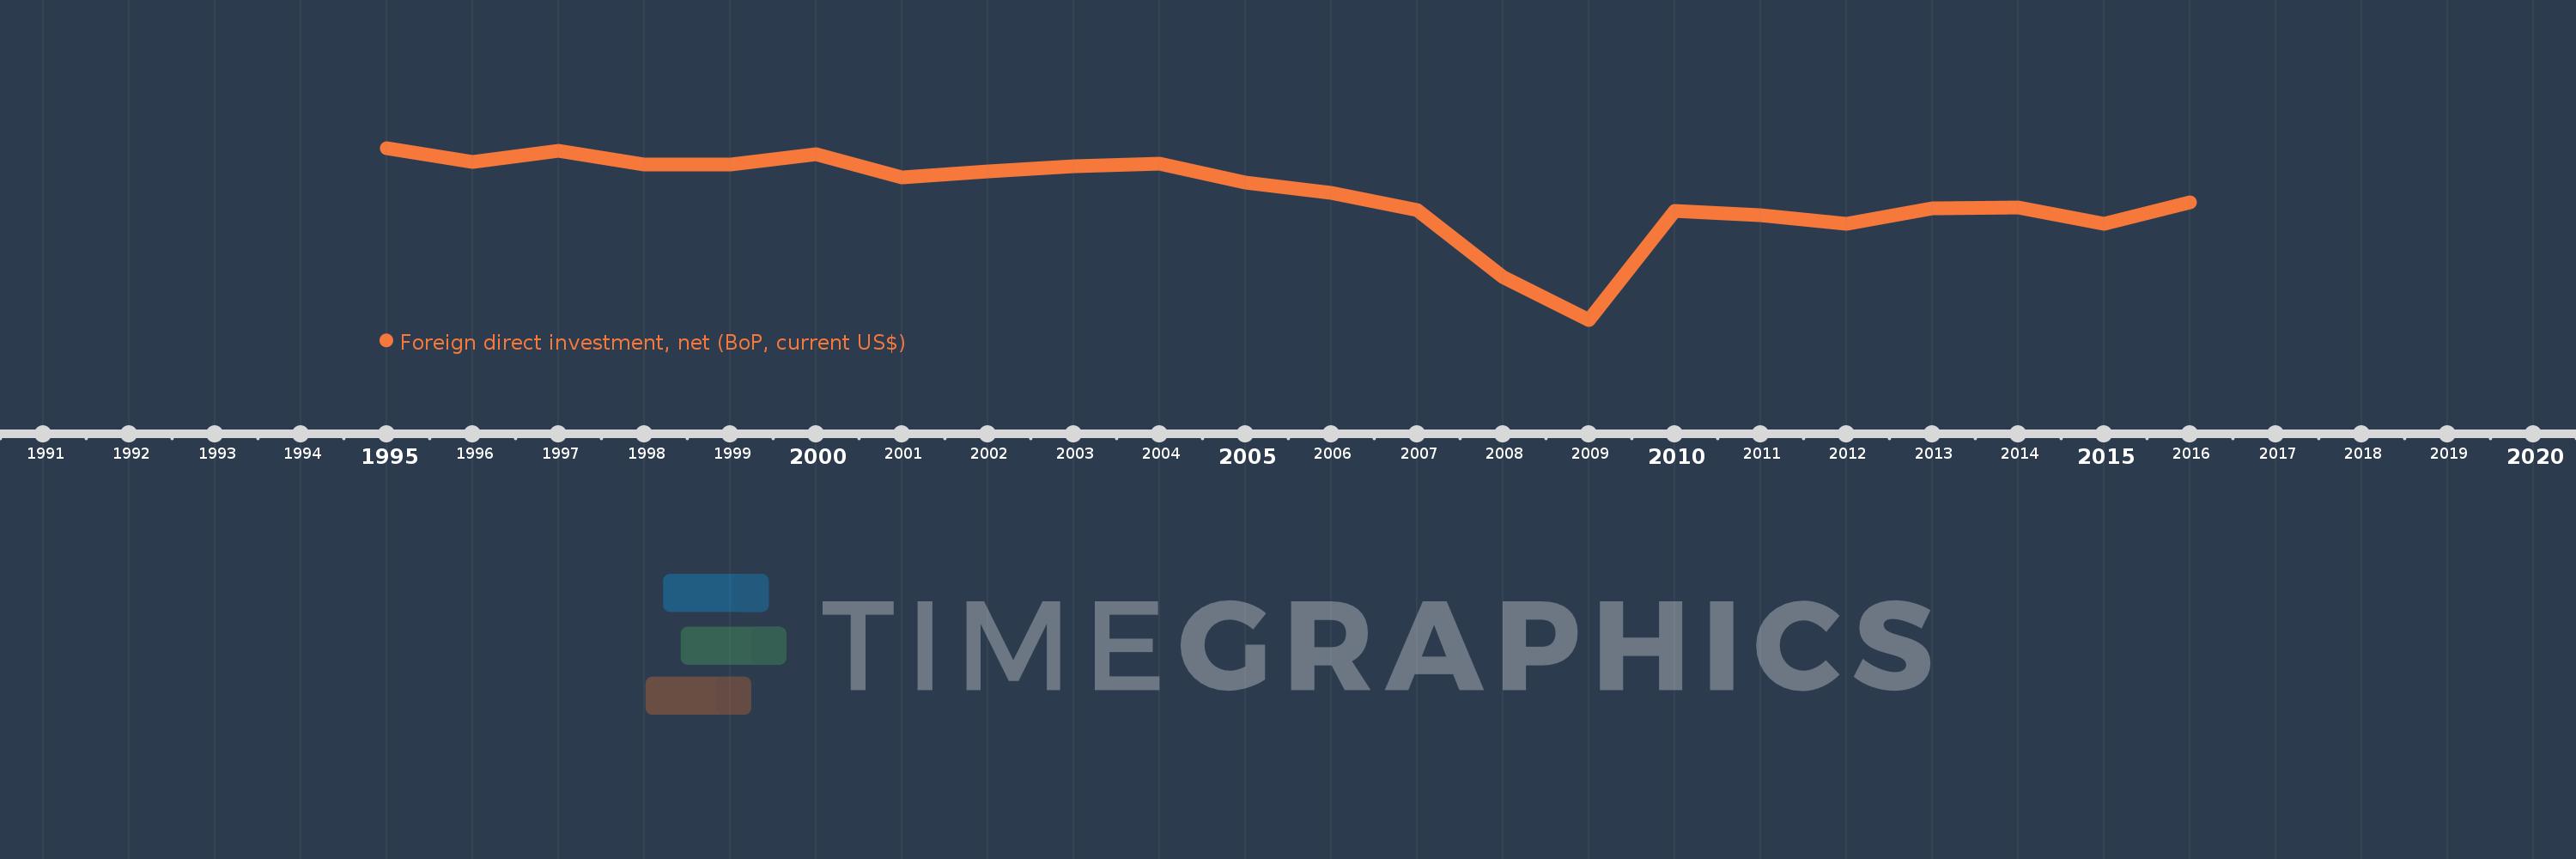
Cette échelle de temps montre un graphique de 1995 année à 2016 année Moldova. Les données jusqu'à 1994 année ne sont pas présentés. Quantité d'observations actuelles selon dates: 22.

Source (désignation):

Les indicateurs du développement mondiale

Source (organisation):

International Monetary Fund, Balance of Payments Statistics Yearbook and data files.

Catégories:

Economy & Growth, Financial Sector

Dernière mise à jour

23 avr. 2017

Les indicateurs de changement de valeurs selon les années

En moyenne:
-199.879 mln.
Minimum:
-695.38 mln.
1 janv. 2009
Maximum:
-11.568 mln.
1 janv. 1995
Pour la date d''observation
Valeur
Changement absolu
Le changement par rapport à la valeur précédente
1 janv. 1995
-11.568 mln.
-11.568 mln.
0.0%
1 janv. 1996
-66.39 mln.
-54.822 mln.
473.91%
1 janv. 1997
-23.18 mln.
+43.21 mln.
-65.09%
1 janv. 1998
-78.29 mln.
-55.11 mln.
237.75%
1 janv. 1999
-76.24 mln.
+2.05 mln.
-2.62%
1 janv. 2000
-37.83 mln.
+38.41 mln.
-50.38%
1 janv. 2001
-127.46 mln.
-89.63 mln.
236.93%
1 janv. 2002
-103.32 mln.
+24.14 mln.
-18.94%
1 janv. 2003
-83.6 mln.
+19.72 mln.
-19.09%
1 janv. 2004
-73.64 mln.
+9.96 mln.
-11.91%
1 janv. 2005
-147.79 mln.
-74.15 mln.
100.69%
1 janv. 2006
-190.86 mln.
-43.07 mln.
29.14%
1 janv. 2007
-259.4 mln.
-68.54 mln.
35.91%
1 janv. 2008
-523.9 mln.
-264.5 mln.
101.97%
1 janv. 2009
-695.38 mln.
-171.48 mln.
32.73%
1 janv. 2010
-261.61 mln.
+433.77 mln.
-62.38%
1 janv. 2011
-278.52 mln.
-16.91 mln.
6.46%
1 janv. 2012
-314.15 mln.
-35.63 mln.
12.79%
1 janv. 2013
-253.0 mln.
+61.15 mln.
-19.47%
1 janv. 2014
-248.84 mln.
+4.16 mln.
-1.64%
1 janv. 2015
-314.44 mln.
-65.6 mln.
26.36%
1 janv. 2016
-227.94 mln.
+86.5 mln.
-27.51%

Classement des pays selon les statistiques actuelles par années