29
/fr/
fr
AIzaSyAYiBZKx7MnpbEhh9jyipgxe19OcubqV5w
April 1, 2024
206732
Nepal
NPL
true
2
1
Foreign direct investment, net (BoP, current US$)
2016,2015,2014,2013,2012,2011,2010,2009,2008,2007,2006,2005,2004,2003,2001,2000,1999,1998,1997
Download
Bibliothèque de statistiques globales →Nepal →

Foreign direct investment, net (BoP, current US$)

Cette statistique dans les autres pays:
AfghanistanAlbaniaAlgeriaAngolaAntigua and BarbudaArgentinaArmeniaArubaAustraliaAustriaAzerbaijanBahamas, TheBahrainBangladeshBarbadosBelarusBelgiumBelizeBeninBermudaBhutanBoliviaBosnia and HerzegovinaBotswanaBrazilBrunei DarussalamBulgariaBurkina FasoBurundiCabo VerdeCambodiaCameroonCanadaCentral African RepublicChadChileChinaColombiaComorosCongo, Dem. Rep.Congo, Rep.Costa RicaCote d'IvoireCroatiaCuracaoCyprusCzech RepublicDenmarkDjiboutiDominicaDominican RepublicEcuadorEgypt, Arab Rep.El SalvadorEquatorial GuineaEritreaEstoniaEthiopiaEuro areaFijiFinlandFranceFrench PolynesiaGabonGambia, TheGeorgiaGermanyGhanaGreeceGrenadaGuatemalaGuineaGuinea-BissauGuyanaHaitiHondurasHong Kong SAR, ChinaHungaryIcelandIndiaIndonesiaIran, Islamic Rep.IraqIrelandIsraelItalyJamaicaJapanJordanKazakhstanKenyaKiribatiKorea, Rep.KosovoKuwaitKyrgyz RepublicLao PDRLatviaLebanonLesothoLiberiaLibyaLithuaniaLuxembourgMacao SAR, ChinaMacedonia, FYRMadagascarMalawiMalaysiaMaldivesMaliMaltaMarshall IslandsMauritaniaMauritiusMexicoMicronesia, Fed. Sts.MoldovaMongoliaMontenegroMoroccoMozambiqueMyanmarNamibiaNepalNetherlandsNew CaledoniaNew ZealandNicaraguaNigerNigeriaNorwayOmanPakistanPalauPanamaPapua New GuineaParaguayPeruPhilippinesPolandPortugalQatarRomaniaRussian FederationRwandaSamoaSao Tome and PrincipeSaudi ArabiaSenegalSerbiaSeychellesSierra LeoneSingaporeSint Maarten (Dutch part)Slovak RepublicSloveniaSolomon IslandsSouth AfricaSouth SudanSpainSri LankaSt. Kitts and NevisSt. LuciaSt. Vincent and the GrenadinesSudanSurinameSwazilandSwedenSwitzerlandSyrian Arab RepublicTajikistanTanzaniaThailandTimor-LesteTogoTongaTrinidad and TobagoTunisiaTurkeyTuvaluUgandaUkraineUnited KingdomUnited StatesUruguayVanuatuVenezuela, RBVietnamWest Bank and GazaYemen, Rep.ZambiaZimbabwe
La ligne de temps
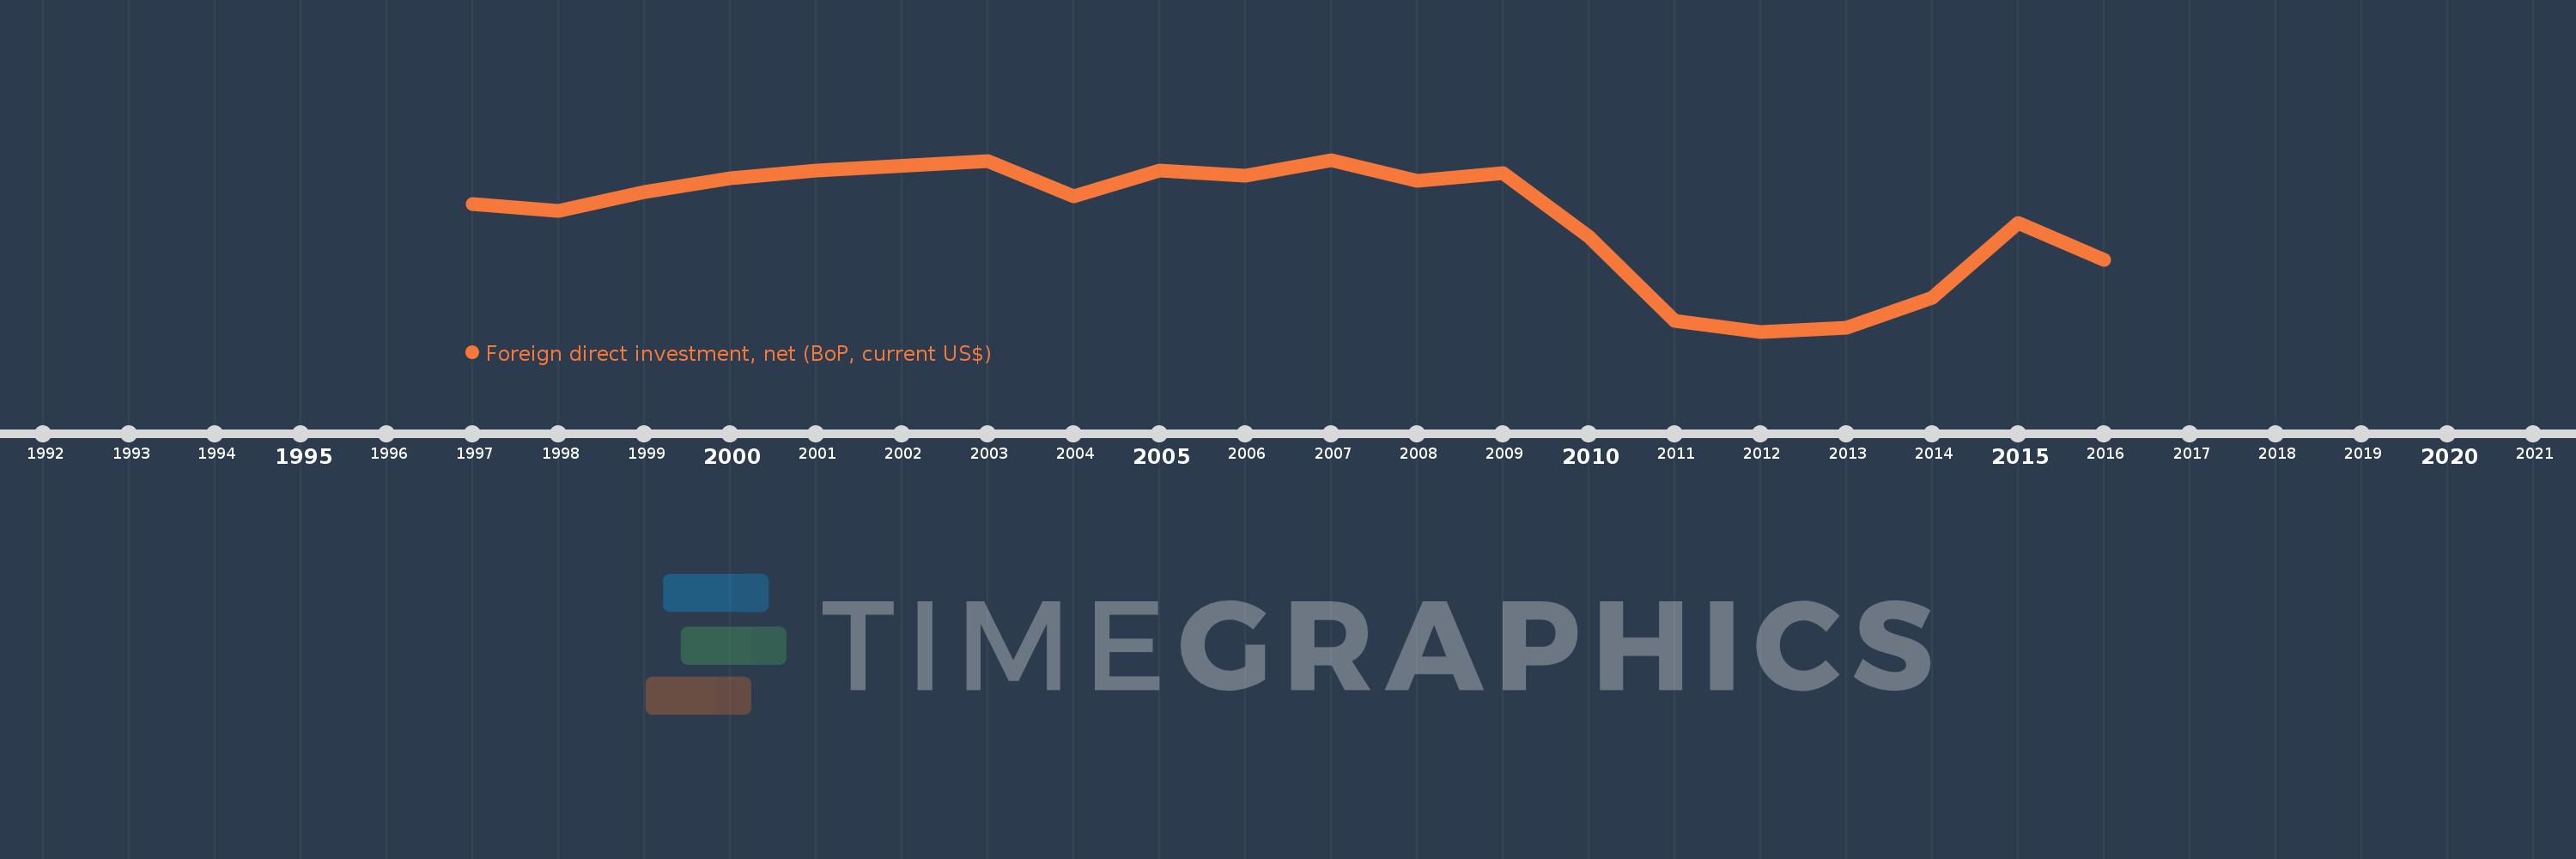
Cette échelle de temps montre un graphique de 1997 année à 2016 année Nepal. Les données jusqu'à 1996 année ne sont pas présentés. Quantité d'observations actuelles selon dates: 19.
Source (désignation):
Les indicateurs du développement mondiale
Source (organisation):
International Monetary Fund, Balance of Payments Statistics Yearbook and data files.
Catégories:
Economy & Growth, Financial Sector
Dernière mise à jour
23 avr. 2017
Les indicateurs de changement de valeurs selon les années
En moyenne:
-28.296 mln.
Minimum:
-94.022 mln.
1 janv. 2012
Maximum:
6.648 mln.
1 janv. 2007
Pour la date d''observation
Valeur
Changement absolu
Le changement par rapport à la valeur précédente
1 janv. 1997
-19.16 mln.
-19.16 mln.
0.0%
1 janv. 1998
-23.056 mln.
-3.896 mln.
20.34%
1 janv. 1999
-12.025 mln.
+11.032 mln.
-47.85%
1 janv. 2000
-4.351 mln.
+7.674 mln.
-63.82%
1 janv. 2001
484.827 milles
+4.836 mln.
-111.14%
1 janv. 2003
5.953 mln.
+5.468 mln.
1.13 milles%
1 janv. 2004
-14.778 mln.
-20.731 mln.
-348.27%
1 janv. 2005
417.346 milles
+15.195 mln.
-102.82%
1 janv. 2006
-2.452 mln.
-2.869 mln.
-687.47%
1 janv. 2007
6.648 mln.
+9.1 mln.
-371.15%
1 janv. 2008
-5.742 mln.
-12.39 mln.
-186.37%
1 janv. 2009
-995.124 milles
+4.747 mln.
-82.67%
1 janv. 2010
-38.271 mln.
-37.276 mln.
3.75 milles%
1 janv. 2011
-87.742 mln.
-49.47 mln.
129.26%
1 janv. 2012
-94.022 mln.
-6.28 mln.
7.16%
1 janv. 2013
-91.997 mln.
+2.026 mln.
-2.15%
1 janv. 2014
-74.245 mln.
+17.752 mln.
-19.3%
1 janv. 2015
-30.403 mln.
+43.842 mln.
-59.05%
1 janv. 2016
-51.896 mln.
-21.492 mln.
70.69%
Classement des pays selon les statistiques actuelles par années

Commentaires:

Envoyer
PremiumAbout & FeedbackUn accordConfidentialité
logo
© 2022 Selected Technologies LLC – Morgan Hill, California