29
/fr/
fr
AIzaSyAYiBZKx7MnpbEhh9jyipgxe19OcubqV5w
April 1, 2024
181079
Lithuania
LTU
true
2
1
Foreign direct investment, net (BoP, current US$)
2016,2015,2014,2013,2012,2011,2010,2009,2008,2007,2006,2005,2004,2003,2002,2001,2000,1999,1998,1997,1996,1995,1994
Download
Bibliothèque de statistiques globales →Lithuania →

Foreign direct investment, net (BoP, current US$)

Cette statistique dans les autres pays:
AfghanistanAlbaniaAlgeriaAngolaAntigua and BarbudaArgentinaArmeniaArubaAustraliaAustriaAzerbaijanBahamas, TheBahrainBangladeshBarbadosBelarusBelgiumBelizeBeninBermudaBhutanBoliviaBosnia and HerzegovinaBotswanaBrazilBrunei DarussalamBulgariaBurkina FasoBurundiCabo VerdeCambodiaCameroonCanadaCentral African RepublicChadChileChinaColombiaComorosCongo, Dem. Rep.Congo, Rep.Costa RicaCote d'IvoireCroatiaCuracaoCyprusCzech RepublicDenmarkDjiboutiDominicaDominican RepublicEcuadorEgypt, Arab Rep.El SalvadorEquatorial GuineaEritreaEstoniaEthiopiaEuro areaFijiFinlandFranceFrench PolynesiaGabonGambia, TheGeorgiaGermanyGhanaGreeceGrenadaGuatemalaGuineaGuinea-BissauGuyanaHaitiHondurasHong Kong SAR, ChinaHungaryIcelandIndiaIndonesiaIran, Islamic Rep.IraqIrelandIsraelItalyJamaicaJapanJordanKazakhstanKenyaKiribatiKorea, Rep.KosovoKuwaitKyrgyz RepublicLao PDRLatviaLebanonLesothoLiberiaLibyaLithuaniaLuxembourgMacao SAR, ChinaMacedonia, FYRMadagascarMalawiMalaysiaMaldivesMaliMaltaMarshall IslandsMauritaniaMauritiusMexicoMicronesia, Fed. Sts.MoldovaMongoliaMontenegroMoroccoMozambiqueMyanmarNamibiaNepalNetherlandsNew CaledoniaNew ZealandNicaraguaNigerNigeriaNorwayOmanPakistanPalauPanamaPapua New GuineaParaguayPeruPhilippinesPolandPortugalQatarRomaniaRussian FederationRwandaSamoaSao Tome and PrincipeSaudi ArabiaSenegalSerbiaSeychellesSierra LeoneSingaporeSint Maarten (Dutch part)Slovak RepublicSloveniaSolomon IslandsSouth AfricaSouth SudanSpainSri LankaSt. Kitts and NevisSt. LuciaSt. Vincent and the GrenadinesSudanSurinameSwazilandSwedenSwitzerlandSyrian Arab RepublicTajikistanTanzaniaThailandTimor-LesteTogoTongaTrinidad and TobagoTunisiaTurkeyTuvaluUgandaUkraineUnited KingdomUnited StatesUruguayVanuatuVenezuela, RBVietnamWest Bank and GazaYemen, Rep.ZambiaZimbabwe
La ligne de temps
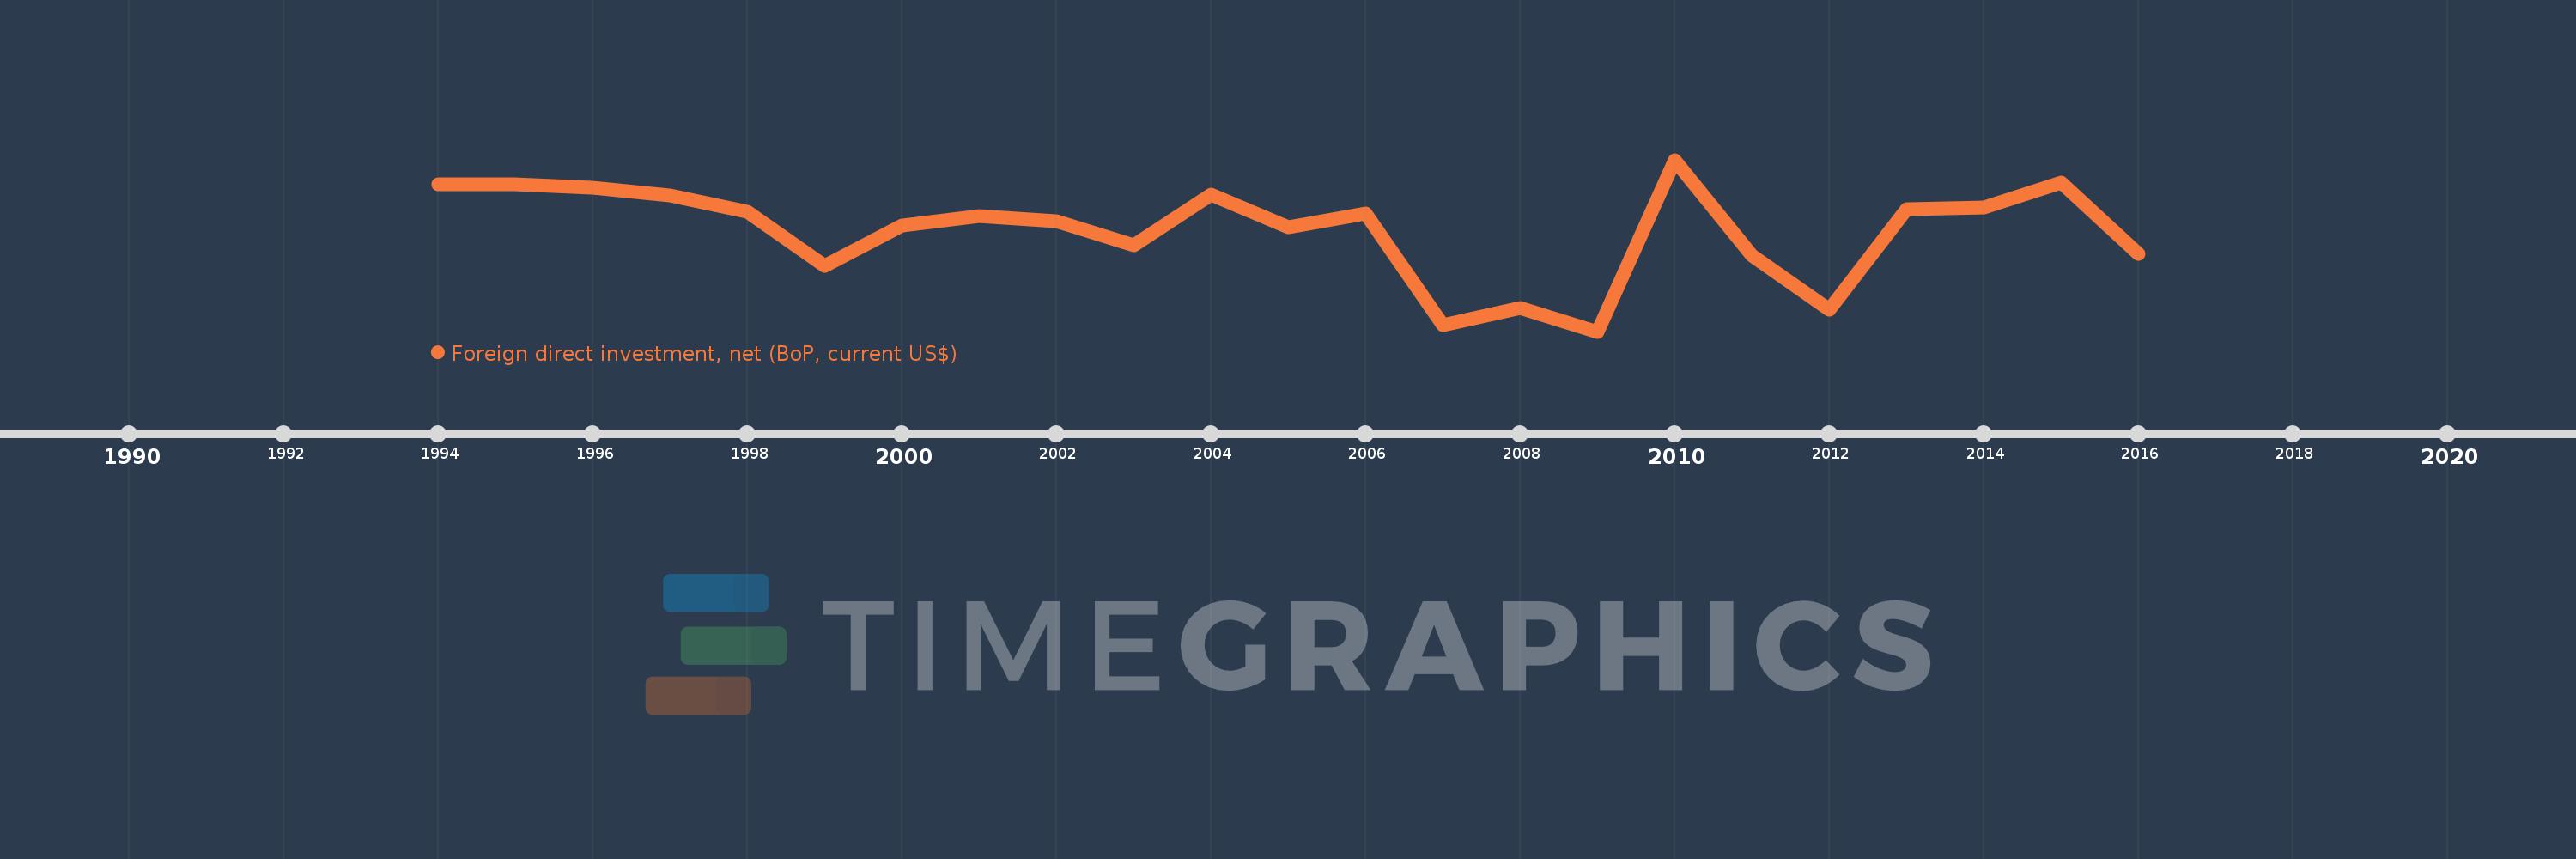
Cette échelle de temps montre un graphique de 1994 année à 2016 année Lithuania. Les données jusqu'à 1993 année ne sont pas présentés. Quantité d'observations actuelles selon dates: 23.
Source (désignation):
Les indicateurs du développement mondiale
Source (organisation):
International Monetary Fund, Balance of Payments Statistics Yearbook and data files.
Catégories:
Economy & Growth, Financial Sector
Dernière mise à jour
23 avr. 2017
Les indicateurs de changement de valeurs selon les années
En moyenne:
-541.149 mln.
Minimum:
-1.636 mds
1 janv. 2009
Maximum:
234.964 mln.
1 janv. 2010
Pour la date d''observation
Valeur
Changement absolu
Le changement par rapport à la valeur précédente
1 janv. 1994
-30.175 mln.
-30.175 mln.
0.0%
1 janv. 1995
-31.305 mln.
-1.13 mln.
3.74%
1 janv. 1996
-71.555 mln.
-40.25 mln.
128.57%
1 janv. 1997
-152.275 mln.
-80.72 mln.
112.81%
1 janv. 1998
-327.6 mln.
-175.325 mln.
115.14%
1 janv. 1999
-921.325 mln.
-593.725 mln.
181.23%
1 janv. 2000
-477.837 mln.
+443.488 mln.
-48.14%
1 janv. 2001
-375.175 mln.
+102.662 mln.
-21.48%
1 janv. 2002
-438.725 mln.
-63.55 mln.
16.94%
1 janv. 2003
-694.779 mln.
-256.054 mln.
58.36%
1 janv. 2004
-141.984 mln.
+552.795 mln.
-79.56%
1 janv. 2005
-498.617 mln.
-356.632 mln.
251.18%
1 janv. 2006
-346.333 mln.
+152.284 mln.
-30.54%
1 janv. 2007
-1.565 mds
-1.219 mds
351.97%
1 janv. 2008
-1.376 mds
+188.917 mln.
-12.07%
1 janv. 2009
-1.636 mds
-260.023 mln.
18.89%
1 janv. 2010
234.964 mln.
+1.871 mds
-114.36%
1 janv. 2011
-808.28 mln.
-1.043 mds
-444.0%
1 janv. 2012
-1.398 mds
-589.911 mln.
72.98%
1 janv. 2013
-300.831 mln.
+1.097 mds
-78.48%
1 janv. 2014
-281.361 mln.
+19.47 mln.
-6.47%
1 janv. 2015
-17.092 mln.
+264.269 mln.
-93.93%
1 janv. 2016
-789.739 mln.
-772.647 mln.
4.52 milles%
Classement des pays selon les statistiques actuelles par années

Commentaires:

Envoyer
PremiumAbout & FeedbackUn accordConfidentialité
logo
© 2022 Selected Technologies LLC – Morgan Hill, California