29
/fr/
fr
AIzaSyAYiBZKx7MnpbEhh9jyipgxe19OcubqV5w
April 1, 2024
88527
Bosnia and Herzegovina
BIH
true
2
1
Foreign direct investment, net (BoP, current US$)
2016,2015,2014,2013,2012,2011,2010,2009,2008,2007,2006,2005,2004,2003,2002,2001,2000,1999
Download
Bibliothèque de statistiques globales →Bosnia and Herzegovina →

Foreign direct investment, net (BoP, current US$)

Cette statistique dans les autres pays:
AfghanistanAlbaniaAlgeriaAngolaAntigua and BarbudaArgentinaArmeniaArubaAustraliaAustriaAzerbaijanBahamas, TheBahrainBangladeshBarbadosBelarusBelgiumBelizeBeninBermudaBhutanBoliviaBosnia and HerzegovinaBotswanaBrazilBrunei DarussalamBulgariaBurkina FasoBurundiCabo VerdeCambodiaCameroonCanadaCentral African RepublicChadChileChinaColombiaComorosCongo, Dem. Rep.Congo, Rep.Costa RicaCote d'IvoireCroatiaCuracaoCyprusCzech RepublicDenmarkDjiboutiDominicaDominican RepublicEcuadorEgypt, Arab Rep.El SalvadorEquatorial GuineaEritreaEstoniaEthiopiaEuro areaFijiFinlandFranceFrench PolynesiaGabonGambia, TheGeorgiaGermanyGhanaGreeceGrenadaGuatemalaGuineaGuinea-BissauGuyanaHaitiHondurasHong Kong SAR, ChinaHungaryIcelandIndiaIndonesiaIran, Islamic Rep.IraqIrelandIsraelItalyJamaicaJapanJordanKazakhstanKenyaKiribatiKorea, Rep.KosovoKuwaitKyrgyz RepublicLao PDRLatviaLebanonLesothoLiberiaLibyaLithuaniaLuxembourgMacao SAR, ChinaMacedonia, FYRMadagascarMalawiMalaysiaMaldivesMaliMaltaMarshall IslandsMauritaniaMauritiusMexicoMicronesia, Fed. Sts.MoldovaMongoliaMontenegroMoroccoMozambiqueMyanmarNamibiaNepalNetherlandsNew CaledoniaNew ZealandNicaraguaNigerNigeriaNorwayOmanPakistanPalauPanamaPapua New GuineaParaguayPeruPhilippinesPolandPortugalQatarRomaniaRussian FederationRwandaSamoaSao Tome and PrincipeSaudi ArabiaSenegalSerbiaSeychellesSierra LeoneSingaporeSint Maarten (Dutch part)Slovak RepublicSloveniaSolomon IslandsSouth AfricaSouth SudanSpainSri LankaSt. Kitts and NevisSt. LuciaSt. Vincent and the GrenadinesSudanSurinameSwazilandSwedenSwitzerlandSyrian Arab RepublicTajikistanTanzaniaThailandTimor-LesteTogoTongaTrinidad and TobagoTunisiaTurkeyTuvaluUgandaUkraineUnited KingdomUnited StatesUruguayVanuatuVenezuela, RBVietnamWest Bank and GazaYemen, Rep.ZambiaZimbabwe
La ligne de temps
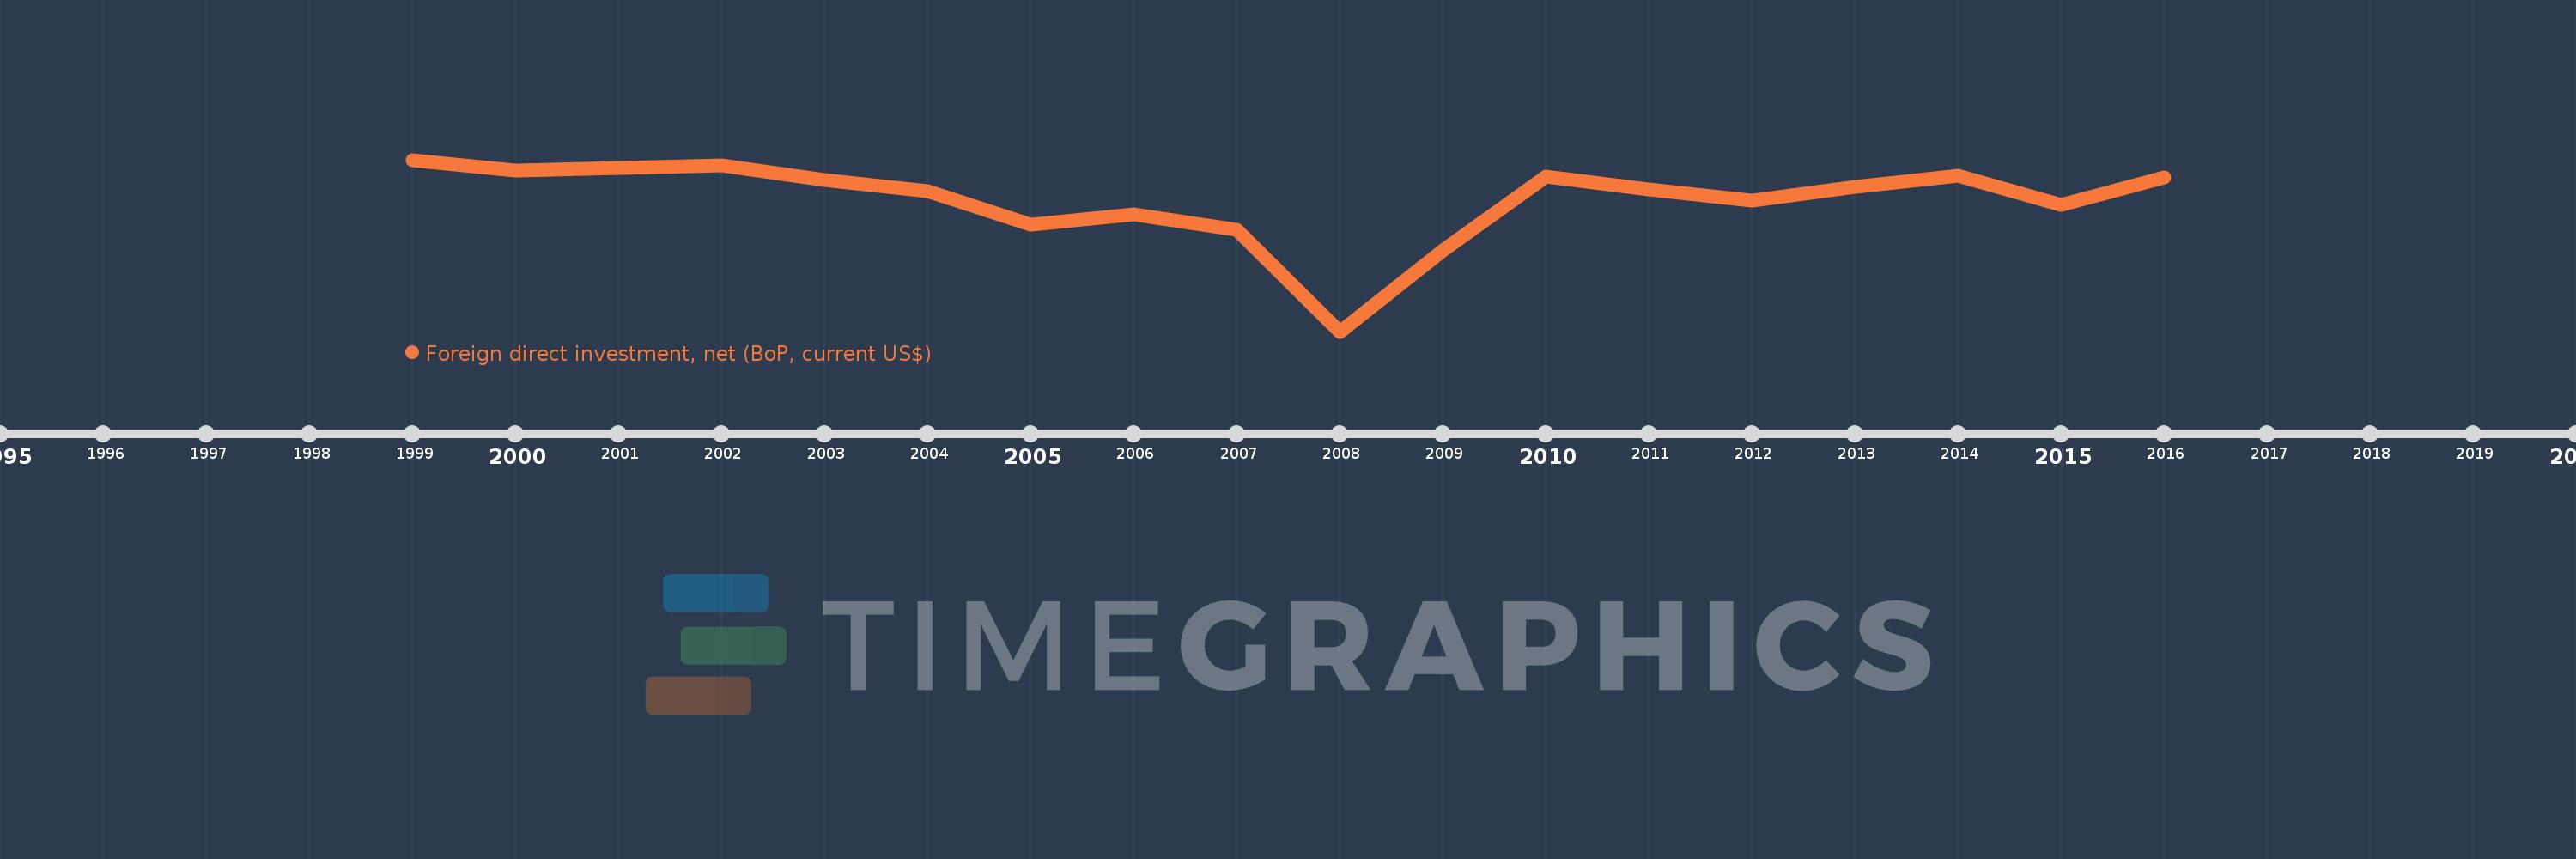
Cette échelle de temps montre un graphique de 1999 année à 2016 année Bosnia and Herzegovina. Les données jusqu'à 1998 année ne sont pas présentés. Quantité d'observations actuelles selon dates: 18.
Source (désignation):
Les indicateurs du développement mondiale
Source (organisation):
International Monetary Fund, Balance of Payments Statistics Yearbook and data files.
Catégories:
Economy & Growth, Financial Sector
Dernière mise à jour
23 avr. 2017
Les indicateurs de changement de valeurs selon les années
En moyenne:
-465.058 mln.
Minimum:
-1.777 mds
1 janv. 2008
Maximum:
-66.736 mln.
1 janv. 1999
Pour la date d''observation
Valeur
Changement absolu
Le changement par rapport à la valeur précédente
1 janv. 1999
-66.736 mln.
-66.736 mln.
0.0%
1 janv. 2000
-176.781 mln.
-110.044 mln.
164.89%
1 janv. 2001
-146.076 mln.
+30.705 mln.
-17.37%
1 janv. 2002
-118.495 mln.
+27.58 mln.
-18.88%
1 janv. 2003
-267.77 mln.
-149.274 mln.
125.97%
1 janv. 2004
-381.785 mln.
-114.015 mln.
42.58%
1 janv. 2005
-708.312 mln.
-326.528 mln.
85.53%
1 janv. 2006
-607.374 mln.
+100.938 mln.
-14.25%
1 janv. 2007
-764.132 mln.
-156.758 mln.
25.81%
1 janv. 2008
-1.777 mds
-1.013 mds
132.6%
1 janv. 2009
-965.405 mln.
+811.968 mln.
-45.68%
1 janv. 2010
-231.999 mln.
+733.406 mln.
-75.97%
1 janv. 2011
-362.66 mln.
-130.662 mln.
56.32%
1 janv. 2012
-476.437 mln.
-113.776 mln.
31.37%
1 janv. 2013
-332.376 mln.
+144.06 mln.
-30.24%
1 janv. 2014
-227.033 mln.
+105.343 mln.
-31.69%
1 janv. 2015
-514.674 mln.
-287.642 mln.
126.7%
1 janv. 2016
-245.629 mln.
+269.045 mln.
-52.27%
Classement des pays selon les statistiques actuelles par années

Commentaires:

Envoyer
PremiumAbout & FeedbackUn accordConfidentialité
logo
© 2022 Selected Technologies LLC – Morgan Hill, California