30
/fr/
AIzaSyAYiBZKx7MnpbEhh9jyipgxe19OcubqV5w
April 1, 2024
138002
Georgia
GEO
true
2
1
Foreign direct investment, net (BoP, current US$)
2016,2015,2014,2013,2012,2011,2010,2009,2008,2007,2006,2005,2004,2003,2002,2001,2000,1999,1998
Download
Bibliothèque de statistiques globales →Georgia →

Foreign direct investment, net (BoP, current US$)

Cette statistique dans les autres pays:

AfghanistanAlbaniaAlgeriaAngolaAntigua and BarbudaArgentinaArmeniaArubaAustraliaAustriaAzerbaijanBahamas, TheBahrainBangladeshBarbadosBelarusBelgiumBelizeBeninBermudaBhutanBoliviaBosnia and HerzegovinaBotswanaBrazilBrunei DarussalamBulgariaBurkina FasoBurundiCabo VerdeCambodiaCameroonCanadaCentral African RepublicChadChileChinaColombiaComorosCongo, Dem. Rep.Congo, Rep.Costa RicaCote d'IvoireCroatiaCuracaoCyprusCzech RepublicDenmarkDjiboutiDominicaDominican RepublicEcuadorEgypt, Arab Rep.El SalvadorEquatorial GuineaEritreaEstoniaEthiopiaEuro areaFijiFinlandFranceFrench PolynesiaGabonGambia, TheGeorgiaGermanyGhanaGreeceGrenadaGuatemalaGuineaGuinea-BissauGuyanaHaitiHondurasHong Kong SAR, ChinaHungaryIcelandIndiaIndonesiaIran, Islamic Rep.IraqIrelandIsraelItalyJamaicaJapanJordanKazakhstanKenyaKiribatiKorea, Rep.KosovoKuwaitKyrgyz RepublicLao PDRLatviaLebanonLesothoLiberiaLibyaLithuaniaLuxembourgMacao SAR, ChinaMacedonia, FYRMadagascarMalawiMalaysiaMaldivesMaliMaltaMarshall IslandsMauritaniaMauritiusMexicoMicronesia, Fed. Sts.MoldovaMongoliaMontenegroMoroccoMozambiqueMyanmarNamibiaNepalNetherlandsNew CaledoniaNew ZealandNicaraguaNigerNigeriaNorwayOmanPakistanPalauPanamaPapua New GuineaParaguayPeruPhilippinesPolandPortugalQatarRomaniaRussian FederationRwandaSamoaSao Tome and PrincipeSaudi ArabiaSenegalSerbiaSeychellesSierra LeoneSingaporeSint Maarten (Dutch part)Slovak RepublicSloveniaSolomon IslandsSouth AfricaSouth SudanSpainSri LankaSt. Kitts and NevisSt. LuciaSt. Vincent and the GrenadinesSudanSurinameSwazilandSwedenSwitzerlandSyrian Arab RepublicTajikistanTanzaniaThailandTimor-LesteTogoTongaTrinidad and TobagoTunisiaTurkeyTuvaluUgandaUkraineUnited KingdomUnited StatesUruguayVanuatuVenezuela, RBVietnamWest Bank and GazaYemen, Rep.ZambiaZimbabwe

La ligne de temps

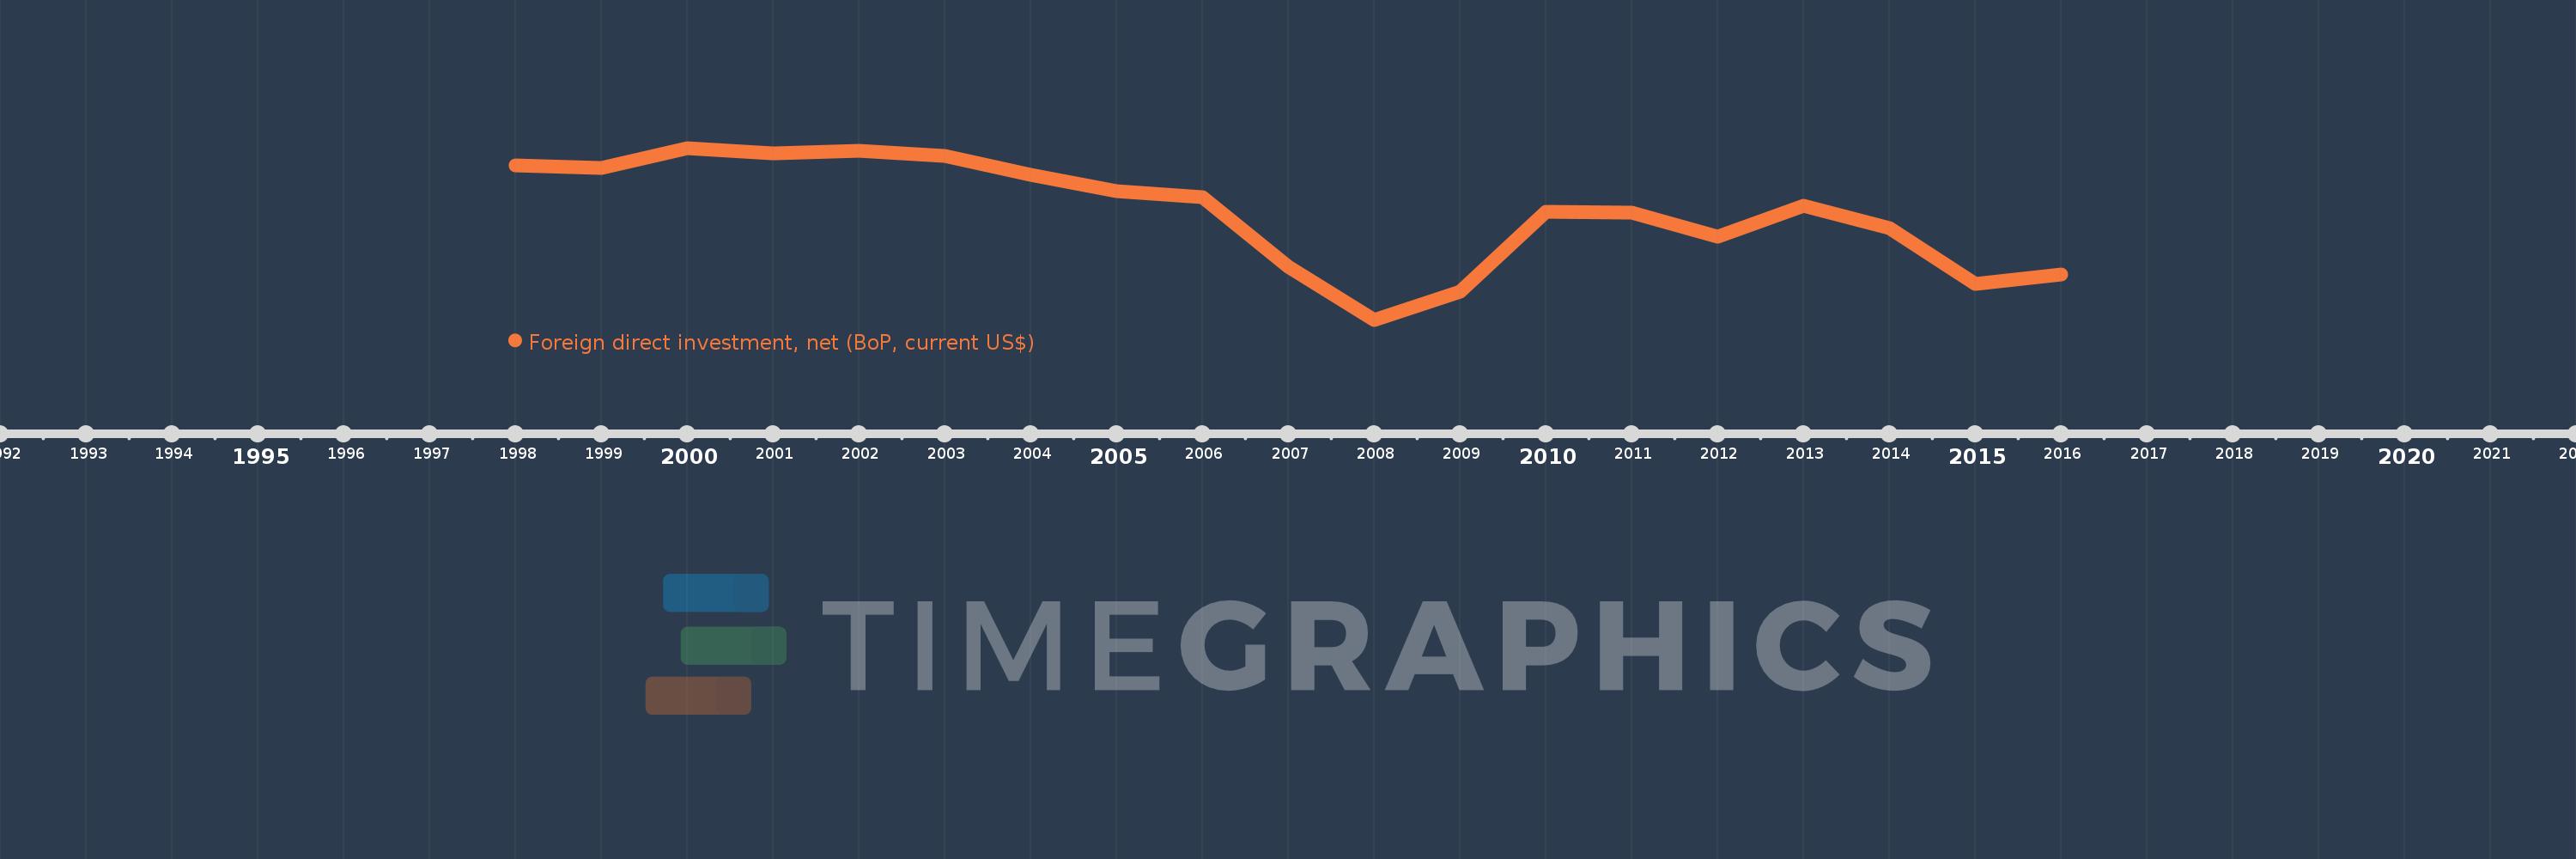
Cette échelle de temps montre un graphique de 1998 année à 2016 année Georgia. Les données jusqu'à 1997 année ne sont pas présentés. Quantité d'observations actuelles selon dates: 19.

Source (désignation):

Les indicateurs du développement mondiale

Source (organisation):

International Monetary Fund, Balance of Payments Statistics Yearbook and data files.

Catégories:

Economy & Growth, Financial Sector

Dernière mise à jour

23 avr. 2017

Les indicateurs de changement de valeurs selon les années

En moyenne:
-679.579 mln.
Minimum:
-1.676 mds
1 janv. 2008
Maximum:
-81.3 mln.
1 janv. 2000
Pour la date d''observation
Valeur
Changement absolu
Le changement par rapport à la valeur précédente
1 janv. 1998
-242.5 mln.
-242.5 mln.
0.0%
1 janv. 1999
-265.3 mln.
-22.8 mln.
9.4%
1 janv. 2000
-81.3 mln.
+184.0 mln.
-69.36%
1 janv. 2001
-128.068 mln.
-46.768 mln.
57.53%
1 janv. 2002
-105.779 mln.
+22.288 mln.
-17.4%
1 janv. 2003
-156.119 mln.
-50.34 mln.
47.59%
1 janv. 2004
-330.887 mln.
-174.767 mln.
111.94%
1 janv. 2005
-482.759 mln.
-151.872 mln.
45.9%
1 janv. 2006
-542.23 mln.
-59.471 mln.
12.32%
1 janv. 2007
-1.183 mds
-641.229 mln.
118.26%
1 janv. 2008
-1.676 mds
-492.89 mln.
41.65%
1 janv. 2009
-1.418 mds
+258.65 mln.
-15.43%
1 janv. 2010
-677.421 mln.
+740.278 mln.
-52.22%
1 janv. 2011
-678.689 mln.
-1.268 mln.
0.19%
1 janv. 2012
-901.617 mln.
-222.928 mln.
32.85%
1 janv. 2013
-614.333 mln.
+287.284 mln.
-31.86%
1 janv. 2014
-829.031 mln.
-214.698 mln.
34.95%
1 janv. 2015
-1.343 mds
-514.074 mln.
62.01%
1 janv. 2016
-1.255 mds
+87.756 mln.
-6.53%

Classement des pays selon les statistiques actuelles par années