29
/fr/
fr
AIzaSyAYiBZKx7MnpbEhh9jyipgxe19OcubqV5w
April 1, 2024
83434
Belize
BLZ
true
2
1
Revenue, excluding grants (current LCU)
2015,2014,2013,2012,2011,2010,2009,2008,2007,2006,2005,2004,2003,2002,2001,2000,1999,1998,1997,1996,1995,1994,1993,1992,1991
Download
Bibliothèque de statistiques globales →Belize →

Revenue, excluding grants (current LCU)

Cette statistique dans les autres pays:
AfghanistanAlbaniaAlgeriaAngolaAntigua and BarbudaArgentinaArmeniaAustraliaAustriaAzerbaijanBahamas, TheBahrainBangladeshBarbadosBelarusBelgiumBelizeBeninBhutanBoliviaBosnia and HerzegovinaBotswanaBrazilBulgariaBurkina FasoBurundiCabo VerdeCambodiaCanadaCentral African RepublicChileChinaColombiaCongo, Dem. Rep.Congo, Rep.Costa RicaCote d'IvoireCroatiaCyprusCzech RepublicDenmarkDominicaDominican RepublicEgypt, Arab Rep.El SalvadorEquatorial GuineaEstoniaEthiopiaFijiFinlandFranceGambia, TheGeorgiaGermanyGhanaGreeceGrenadaGuatemalaHondurasHong Kong SAR, ChinaHungaryIcelandIndiaIndonesiaIran, Islamic Rep.IraqIrelandIsraelItalyJamaicaJapanJordanKazakhstanKenyaKiribatiKorea, Rep.KuwaitKyrgyz RepublicLao PDRLatviaLebanonLesothoLiberiaLithuaniaLuxembourgMacao SAR, ChinaMacedonia, FYRMadagascarMalawiMalaysiaMaldivesMaliMaltaMauritiusMexicoMicronesia, Fed. Sts.MoldovaMongoliaMoroccoMozambiqueMyanmarNamibiaNepalNetherlandsNew ZealandNicaraguaNigeriaNorwayOmanPakistanPanamaPapua New GuineaParaguayPeruPhilippinesPolandPortugalQatarRomaniaRussian FederationRwandaSamoaSan MarinoSao Tome and PrincipeSenegalSerbiaSeychellesSierra LeoneSingaporeSlovak RepublicSloveniaSolomon IslandsSouth AfricaSpainSri LankaSt. Kitts and NevisSt. LuciaSt. Vincent and the GrenadinesSurinameSwazilandSwedenSwitzerlandSyrian Arab RepublicTajikistanTanzaniaThailandTimor-LesteTogoTrinidad and TobagoTunisiaTurkeyUgandaUkraineUnited Arab EmiratesUnited KingdomUnited StatesUruguayVanuatuVenezuela, RBVietnamWest Bank and GazaYemen, Rep.ZambiaZimbabwe
La ligne de temps
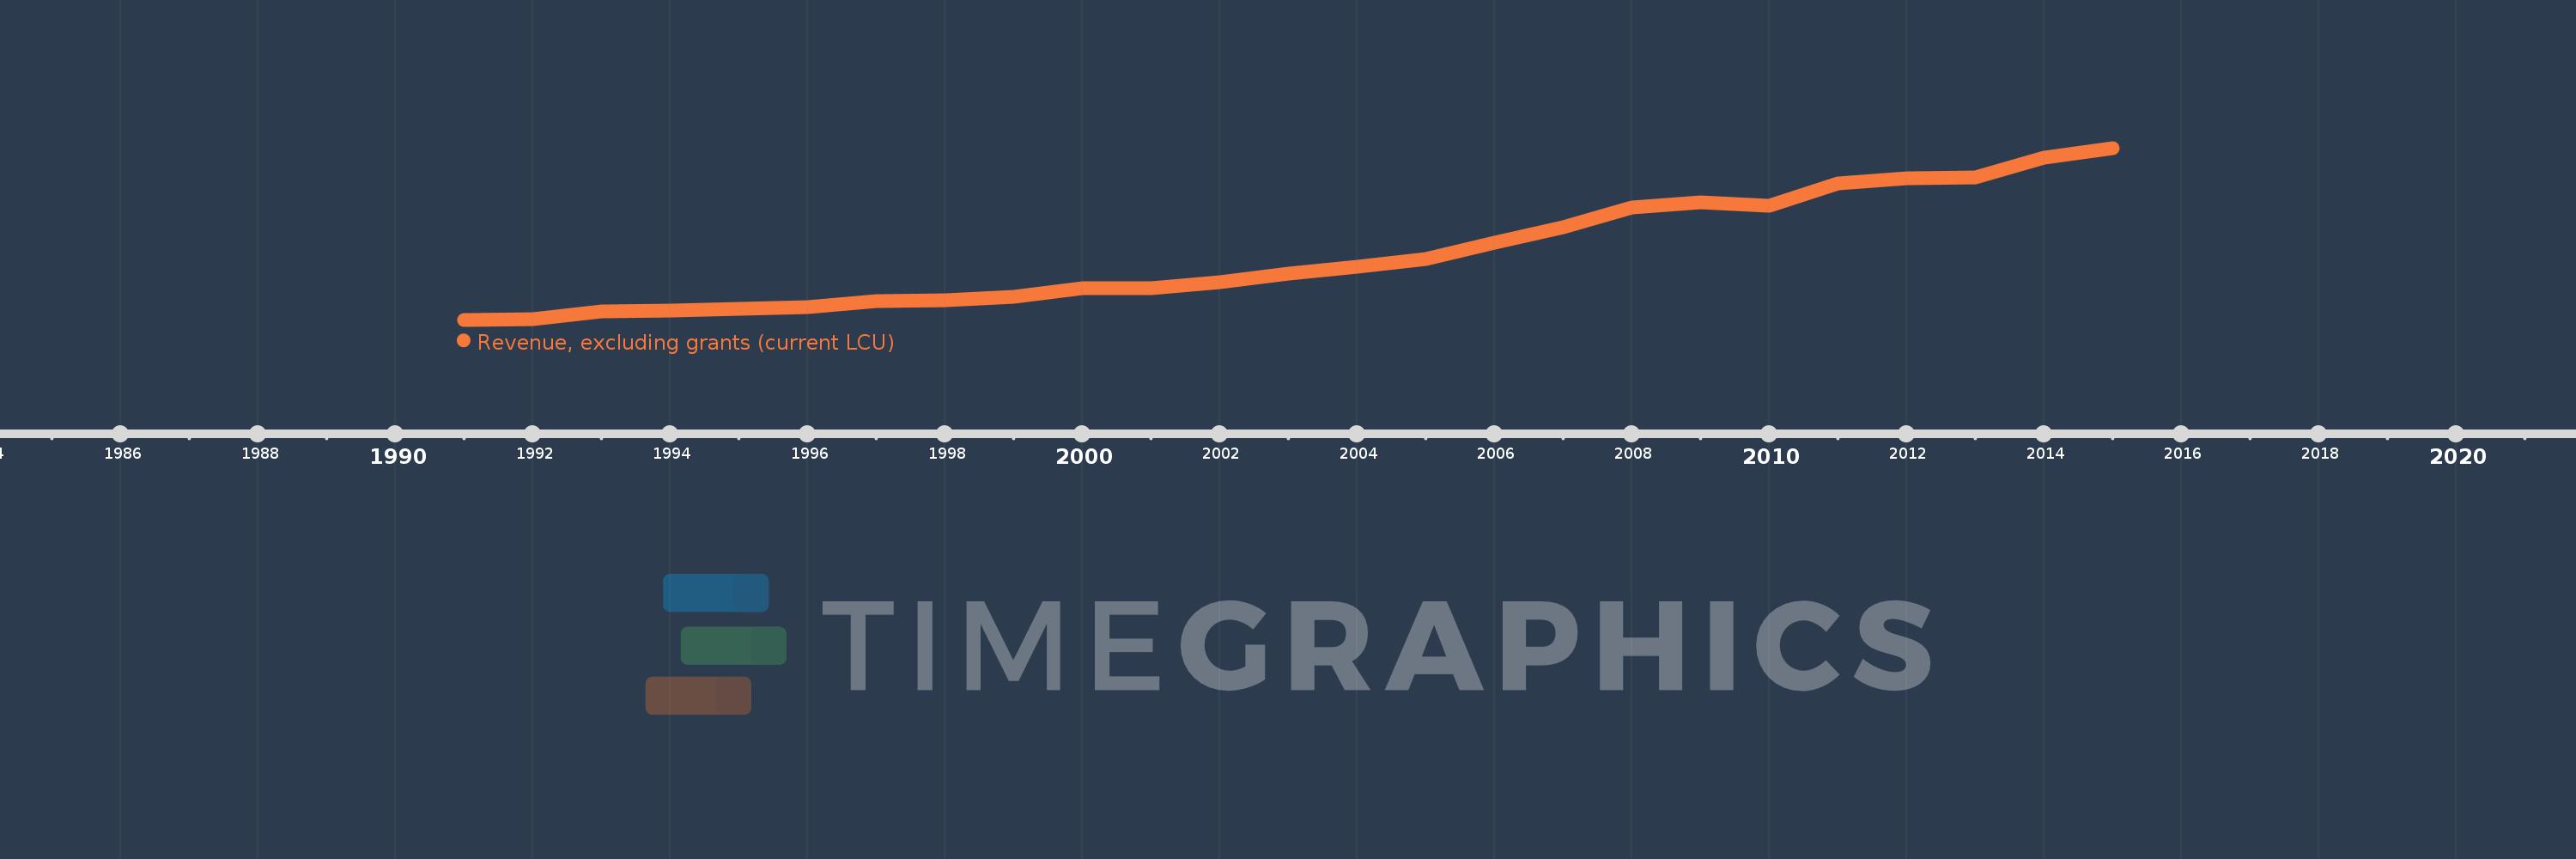
Cette échelle de temps montre un graphique de 1991 année à 2015 année Belize. Les données jusqu'à 1990 année ne sont pas présentés. Quantité d'observations actuelles selon dates: 25.
Source (désignation):
Les indicateurs du développement mondiale
Source (organisation):
International Monetary Fund, Government Finance Statistics Yearbook and data files.
Catégories:
Public Sector
Dernière mise à jour
23 avr. 2017
Les indicateurs de changement de valeurs selon les années
En moyenne:
474.239 mln.
Minimum:
209.747 mln.
1 janv. 1991
Maximum:
906.735 mln.
1 janv. 2015
Pour la date d''observation
Valeur
Changement absolu
Le changement par rapport à la valeur précédente
1 janv. 1991
209.747 mln.
+209.747 mln.
0.0%
1 janv. 1992
213.883 mln.
+4.136 mln.
1.97%
1 janv. 1993
242.434 mln.
+28.551 mln.
13.35%
1 janv. 1994
245.624 mln.
+3.19 mln.
1.32%
1 janv. 1995
254.601 mln.
+8.977 mln.
3.65%
1 janv. 1996
259.9 mln.
+5.299 mln.
2.08%
1 janv. 1997
285.649 mln.
+25.749 mln.
9.91%
1 janv. 1998
287.957 mln.
+2.308 mln.
0.81%
1 janv. 1999
302.143 mln.
+14.186 mln.
4.93%
1 janv. 2000
337.386 mln.
+35.243 mln.
11.66%
1 janv. 2001
338.79 mln.
+1.404 mln.
0.42%
1 janv. 2002
362.348 mln.
+23.558 mln.
6.95%
1 janv. 2003
397.172 mln.
+34.824 mln.
9.61%
1 janv. 2004
424.3 mln.
+27.128 mln.
6.83%
1 janv. 2005
455.43 mln.
+31.13 mln.
7.34%
1 janv. 2006
524.004 mln.
+68.574 mln.
15.06%
1 janv. 2007
583.886 mln.
+59.882 mln.
11.43%
1 janv. 2008
666.013 mln.
+82.127 mln.
14.07%
1 janv. 2009
685.392 mln.
+19.379 mln.
2.91%
1 janv. 2010
673.486 mln.
-11.906 mln.
-1.74%
1 janv. 2011
762.287 mln.
+88.801 mln.
13.19%
1 janv. 2012
784.599 mln.
+22.312 mln.
2.93%
1 janv. 2013
786.315 mln.
+1.716 mln.
0.22%
1 janv. 2014
865.905 mln.
+79.59 mln.
10.12%
1 janv. 2015
906.735 mln.
+40.83 mln.
4.72%
Classement des pays selon les statistiques actuelles par années

Commentaires:

Envoyer
PremiumAbout & FeedbackUn accordConfidentialité
logo
© 2022 Selected Technologies LLC – Morgan Hill, California