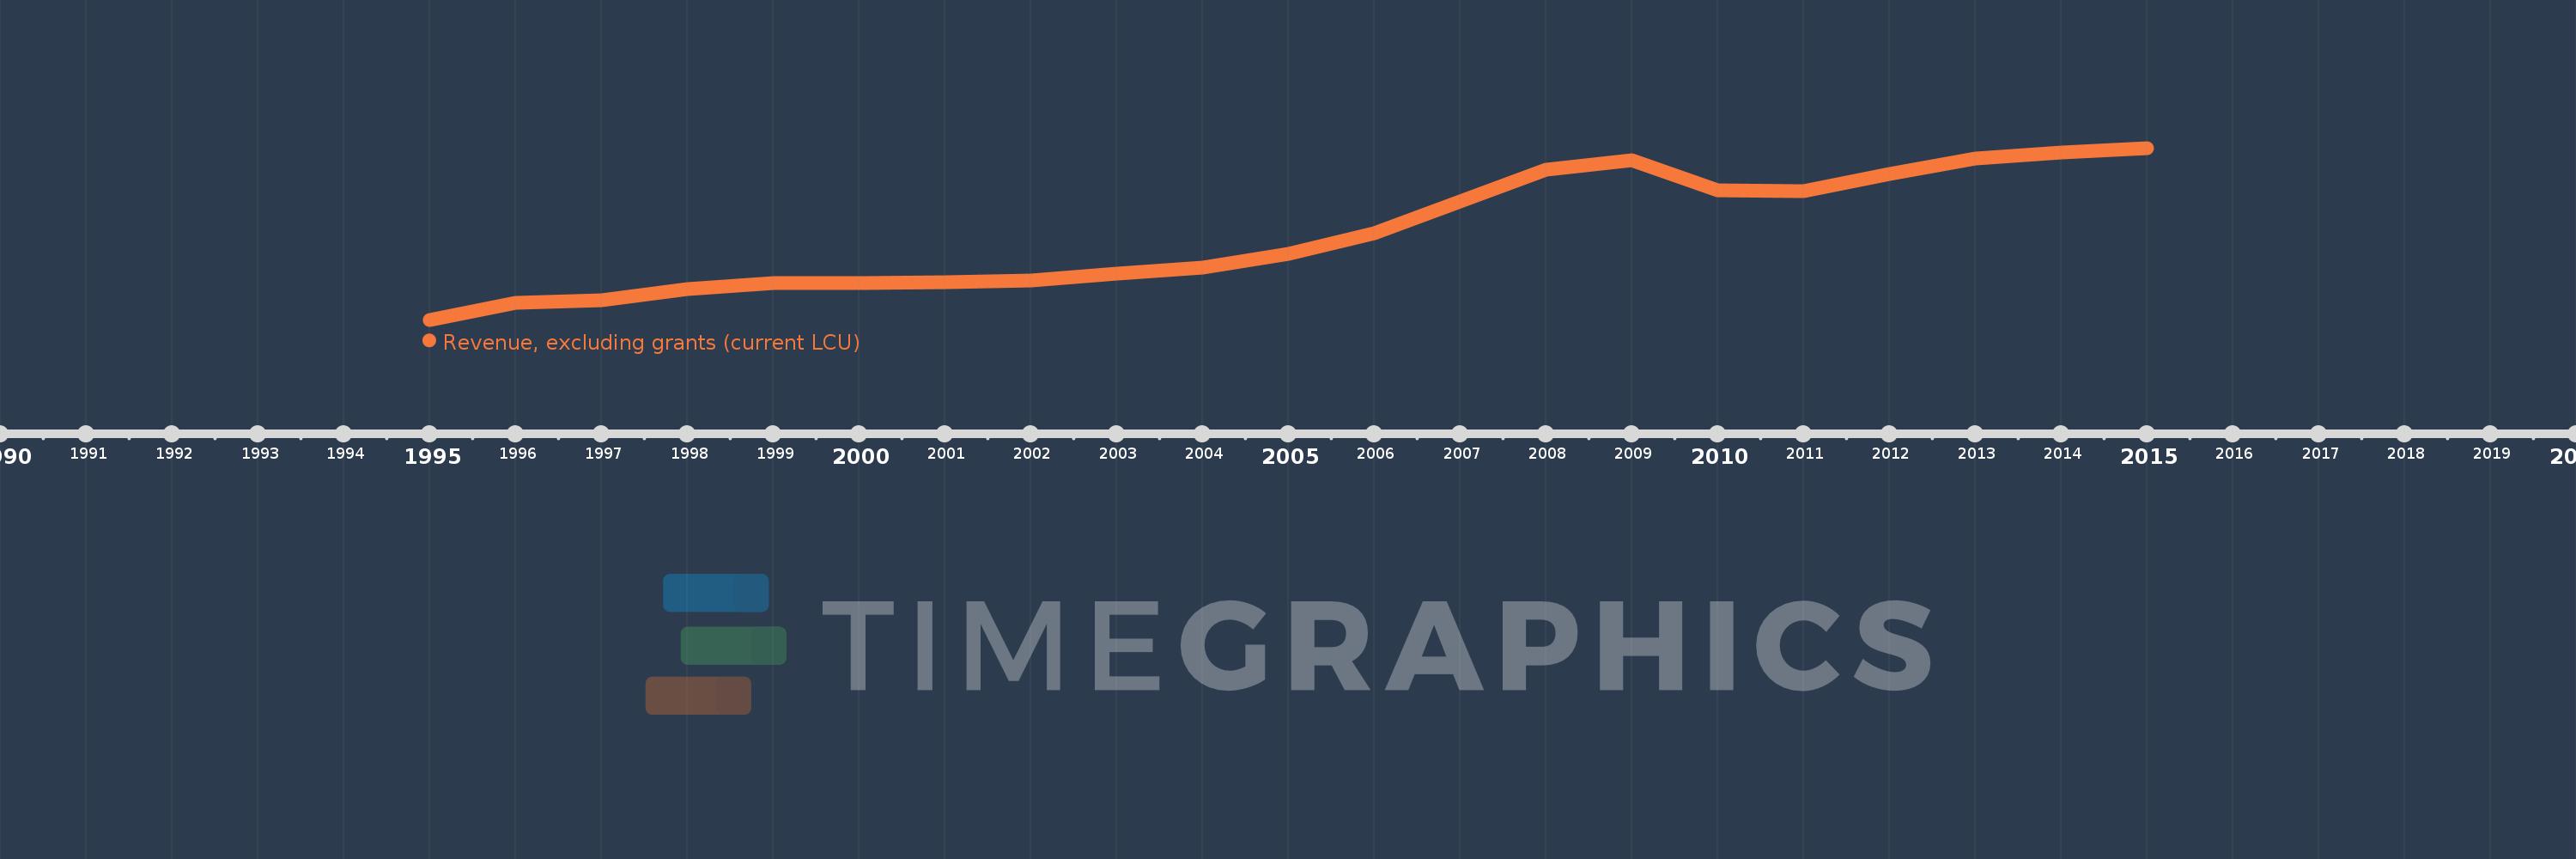
Cette échelle de temps montre un graphique de 1995 année à 2015 année Latvia. Les données jusqu'à 1994 année ne sont pas présentés. Quantité d'observations actuelles selon dates: 21.
Source (désignation):
Les indicateurs du développement mondiale
Source (organisation):
International Monetary Fund, Government Finance Statistics Yearbook and data files.
Catégories:
Public Sector
Dernière mise à jour
23 avr. 2017
Les indicateurs de changement de valeurs selon les années
En moyenne:
5.264 mds
Minimum:
742.341 mln.
1 janv. 1995
Maximum:
9.805 mds
1 janv. 2015
Pour la date d''observation
Valeur
Changement absolu
Le changement par rapport à la valeur précédente
1 janv. 1995
742.341 mln.
+742.341 mln.
0.0%
1 janv. 1996
1.652 mds
+909.983 mln.
122.58%
1 janv. 1997
1.79 mds
+137.805 mln.
8.34%
1 janv. 1998
2.352 mds
+562.006 mln.
31.39%
1 janv. 1999
2.655 mds
+302.929 mln.
12.88%
1 janv. 2000
2.696 mds
+40.95 mln.
1.54%
1 janv. 2001
2.72 mds
+24.004 mln.
0.89%
1 janv. 2002
2.821 mds
+101.095 mln.
3.72%
1 janv. 2003
3.177 mds
+356.102 mln.
12.62%
1 janv. 2004
3.502 mds
+324.941 mln.
10.23%
1 janv. 2005
4.237 mds
+734.387 mln.
20.97%
1 janv. 2006
5.308 mds
+1.071 mds
25.28%
1 janv. 2007
6.994 mds
+1.686 mds
31.77%
1 janv. 2008
8.641 mds
+1.647 mds
23.55%
1 janv. 2009
9.166 mds
+524.727 mln.
6.07%
1 janv. 2010
7.576 mds
-1.59 mds
-17.35%
1 janv. 2011
7.505 mds
-70.347 mln.
-0.93%
1 janv. 2012
8.417 mds
+911.776 mln.
12.15%
1 janv. 2013
9.242 mds
+824.697 mln.
9.8%
1 janv. 2014
9.55 mds
+308.792 mln.
3.34%
1 janv. 2015
9.805 mds
+254.253 mln.
2.66%
Classement des pays selon les statistiques actuelles par années