29
/fr/
fr
AIzaSyAYiBZKx7MnpbEhh9jyipgxe19OcubqV5w
April 1, 2024
250268
St. Kitts and Nevis
KNA
true
2
1
Revenue, excluding grants (current LCU)
2015,2014,2013,2012,2011,2010,2009,2008,2007,2006,2005,2004,2003,2002,2001,1995,1994,1993,1992,1991
Download
Bibliothèque de statistiques globales →St. Kitts and Nevis →

Revenue, excluding grants (current LCU)

Cette statistique dans les autres pays:
AfghanistanAlbaniaAlgeriaAngolaAntigua and BarbudaArgentinaArmeniaAustraliaAustriaAzerbaijanBahamas, TheBahrainBangladeshBarbadosBelarusBelgiumBelizeBeninBhutanBoliviaBosnia and HerzegovinaBotswanaBrazilBulgariaBurkina FasoBurundiCabo VerdeCambodiaCanadaCentral African RepublicChileChinaColombiaCongo, Dem. Rep.Congo, Rep.Costa RicaCote d'IvoireCroatiaCyprusCzech RepublicDenmarkDominicaDominican RepublicEgypt, Arab Rep.El SalvadorEquatorial GuineaEstoniaEthiopiaFijiFinlandFranceGambia, TheGeorgiaGermanyGhanaGreeceGrenadaGuatemalaHondurasHong Kong SAR, ChinaHungaryIcelandIndiaIndonesiaIran, Islamic Rep.IraqIrelandIsraelItalyJamaicaJapanJordanKazakhstanKenyaKiribatiKorea, Rep.KuwaitKyrgyz RepublicLao PDRLatviaLebanonLesothoLiberiaLithuaniaLuxembourgMacao SAR, ChinaMacedonia, FYRMadagascarMalawiMalaysiaMaldivesMaliMaltaMauritiusMexicoMicronesia, Fed. Sts.MoldovaMongoliaMoroccoMozambiqueMyanmarNamibiaNepalNetherlandsNew ZealandNicaraguaNigeriaNorwayOmanPakistanPanamaPapua New GuineaParaguayPeruPhilippinesPolandPortugalQatarRomaniaRussian FederationRwandaSamoaSan MarinoSao Tome and PrincipeSenegalSerbiaSeychellesSierra LeoneSingaporeSlovak RepublicSloveniaSolomon IslandsSouth AfricaSpainSri LankaSt. Kitts and NevisSt. LuciaSt. Vincent and the GrenadinesSurinameSwazilandSwedenSwitzerlandSyrian Arab RepublicTajikistanTanzaniaThailandTimor-LesteTogoTrinidad and TobagoTunisiaTurkeyUgandaUkraineUnited Arab EmiratesUnited KingdomUnited StatesUruguayVanuatuVenezuela, RBVietnamWest Bank and GazaYemen, Rep.ZambiaZimbabwe
La ligne de temps
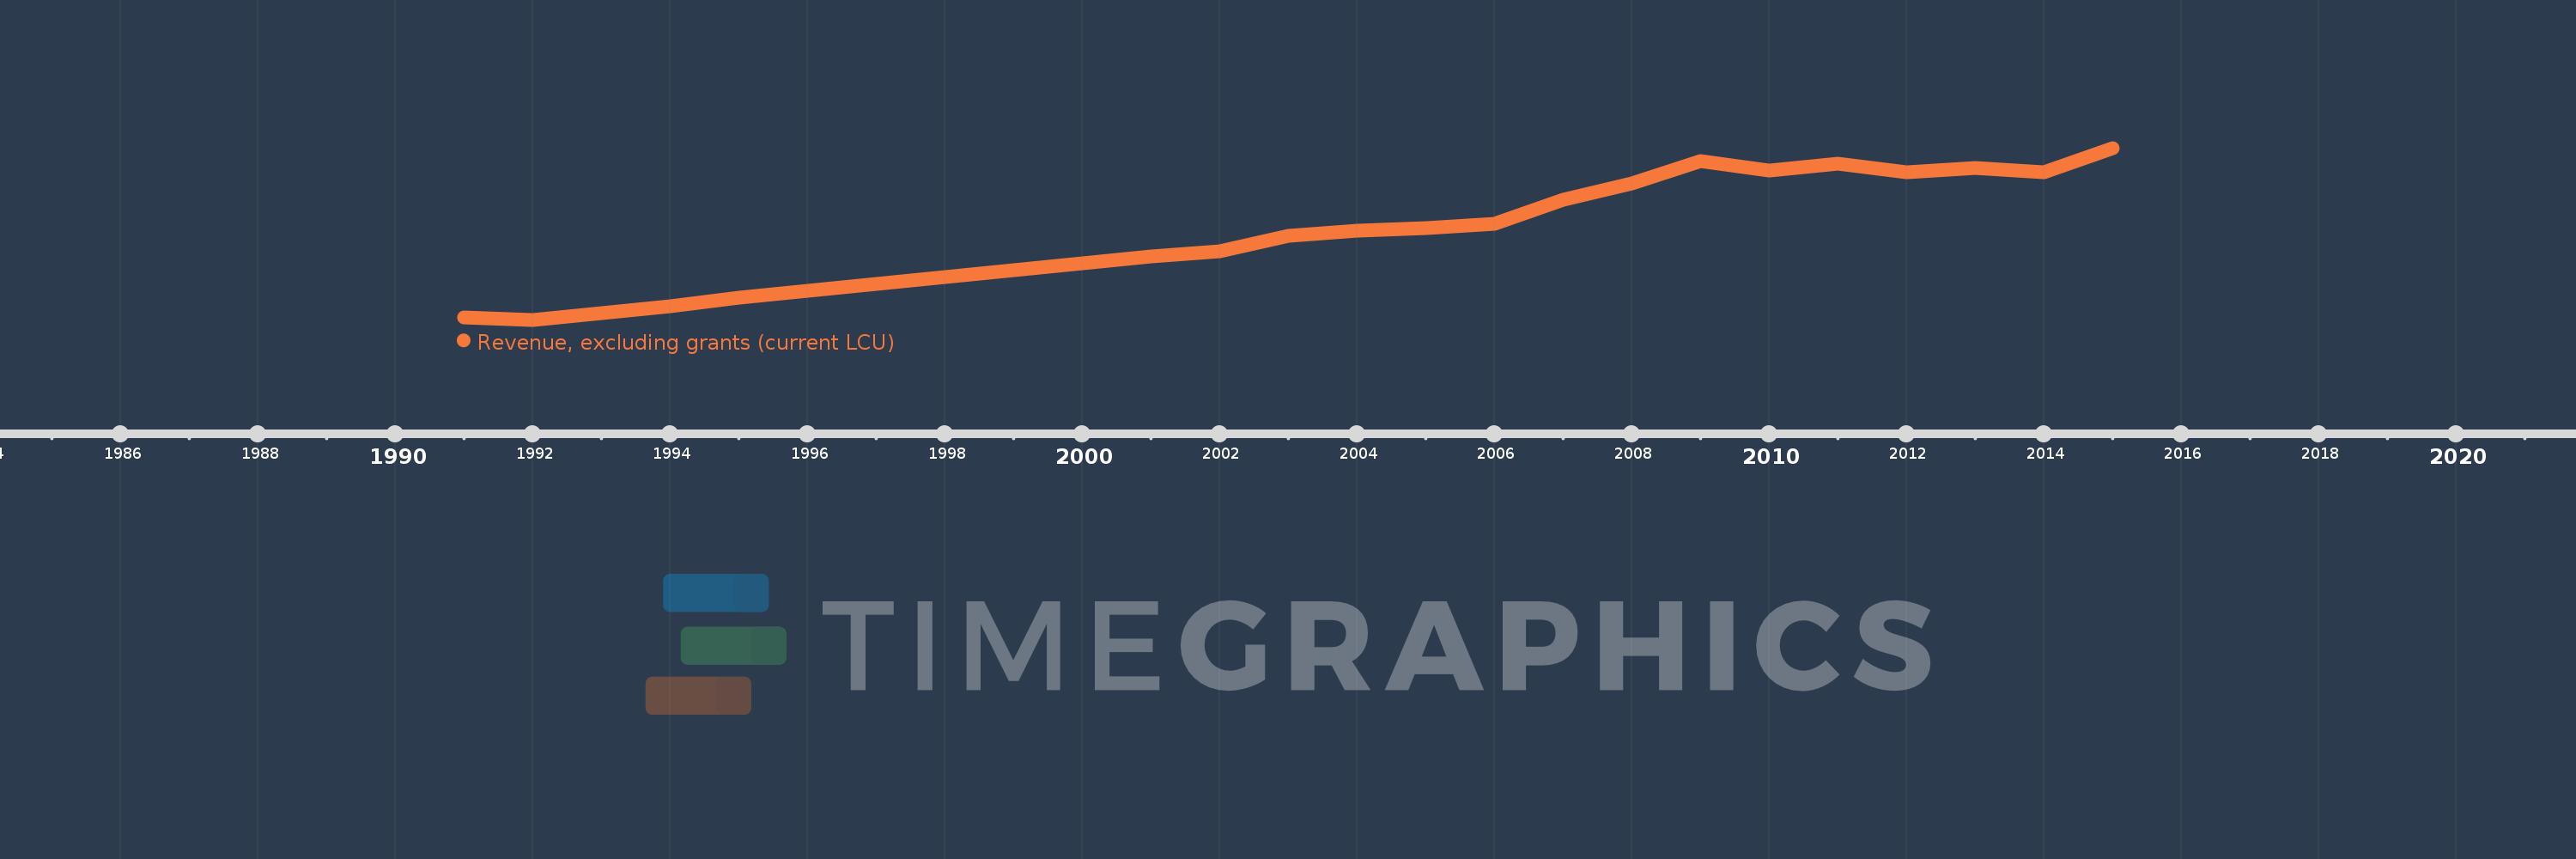
Cette échelle de temps montre un graphique de 1991 année à 2015 année St. Kitts and Nevis. Les données jusqu'à 1990 année ne sont pas présentés. Quantité d'observations actuelles selon dates: 20.
Source (désignation):
Les indicateurs du développement mondiale
Source (organisation):
International Monetary Fund, Government Finance Statistics Yearbook and data files.
Catégories:
Public Sector
Dernière mise à jour
23 avr. 2017
Les indicateurs de changement de valeurs selon les années
En moyenne:
329.484 mln.
Minimum:
97.64 mln.
1 janv. 1992
Maximum:
521.747 mln.
1 janv. 2015
Pour la date d''observation
Valeur
Changement absolu
Le changement par rapport à la valeur précédente
1 janv. 1991
104.17 mln.
+104.17 mln.
0.0%
1 janv. 1992
97.64 mln.
-6.53 mln.
-6.27%
1 janv. 1993
113.36 mln.
+15.72 mln.
16.1%
1 janv. 1994
129.89 mln.
+16.53 mln.
14.58%
1 janv. 1995
152.97 mln.
+23.08 mln.
17.77%
1 janv. 2001
254.3 mln.
+101.33 mln.
66.24%
1 janv. 2002
267.3 mln.
+13.0 mln.
5.11%
1 janv. 2003
305.632 mln.
+38.332 mln.
14.34%
1 janv. 2004
318.237 mln.
+12.605 mln.
4.12%
1 janv. 2005
324.892 mln.
+6.655 mln.
2.09%
1 janv. 2006
334.05 mln.
+9.158 mln.
2.82%
1 janv. 2007
394.421 mln.
+60.371 mln.
18.07%
1 janv. 2008
433.524 mln.
+39.102 mln.
9.91%
1 janv. 2009
489.547 mln.
+56.024 mln.
12.92%
1 janv. 2010
466.51 mln.
-23.037 mln.
-4.71%
1 janv. 2011
483.803 mln.
+17.293 mln.
3.71%
1 janv. 2012
462.478 mln.
-21.325 mln.
-4.41%
1 janv. 2013
472.623 mln.
+10.146 mln.
2.19%
1 janv. 2014
462.583 mln.
-10.041 mln.
-2.12%
1 janv. 2015
521.747 mln.
+59.165 mln.
12.79%
Classement des pays selon les statistiques actuelles par années

Commentaires:

Envoyer
PremiumAbout & FeedbackUn accordConfidentialité
logo
© 2022 Selected Technologies LLC – Morgan Hill, California