33
/fr/
AIzaSyAYiBZKx7MnpbEhh9jyipgxe19OcubqV5w
August 1, 2025
76617
Bahamas, The
BHS
true
2
1
Revenue, excluding grants (current LCU)
1990,1989,1987,1986,1985,1984,1983,1982,1981,1980,1979,1978,1977,1976,1975,1974
Download
Bibliothèque de statistiques globales →Bahamas, The →

Revenue, excluding grants (current LCU)

Cette statistique dans les autres pays:

AfghanistanAlbaniaAlgeriaAngolaAntigua and BarbudaArgentinaArmeniaAustraliaAustriaAzerbaijanBahamas, TheBahrainBangladeshBarbadosBelarusBelgiumBelizeBeninBhutanBoliviaBosnia and HerzegovinaBotswanaBrazilBulgariaBurkina FasoBurundiCabo VerdeCambodiaCanadaCentral African RepublicChileChinaColombiaCongo, Dem. Rep.Congo, Rep.Costa RicaCote d'IvoireCroatiaCyprusCzech RepublicDenmarkDominicaDominican RepublicEgypt, Arab Rep.El SalvadorEquatorial GuineaEstoniaEthiopiaFijiFinlandFranceGambia, TheGeorgiaGermanyGhanaGreeceGrenadaGuatemalaHondurasHong Kong SAR, ChinaHungaryIcelandIndiaIndonesiaIran, Islamic Rep.IraqIrelandIsraelItalyJamaicaJapanJordanKazakhstanKenyaKiribatiKorea, Rep.KuwaitKyrgyz RepublicLao PDRLatviaLebanonLesothoLiberiaLithuaniaLuxembourgMacao SAR, ChinaMacedonia, FYRMadagascarMalawiMalaysiaMaldivesMaliMaltaMauritiusMexicoMicronesia, Fed. Sts.MoldovaMongoliaMoroccoMozambiqueMyanmarNamibiaNepalNetherlandsNew ZealandNicaraguaNigeriaNorwayOmanPakistanPanamaPapua New GuineaParaguayPeruPhilippinesPolandPortugalQatarRomaniaRussian FederationRwandaSamoaSan MarinoSao Tome and PrincipeSenegalSerbiaSeychellesSierra LeoneSingaporeSlovak RepublicSloveniaSolomon IslandsSouth AfricaSpainSri LankaSt. Kitts and NevisSt. LuciaSt. Vincent and the GrenadinesSurinameSwazilandSwedenSwitzerlandSyrian Arab RepublicTajikistanTanzaniaThailandTimor-LesteTogoTrinidad and TobagoTunisiaTurkeyUgandaUkraineUnited Arab EmiratesUnited KingdomUnited StatesUruguayVanuatuVenezuela, RBVietnamWest Bank and GazaYemen, Rep.ZambiaZimbabwe

La ligne de temps

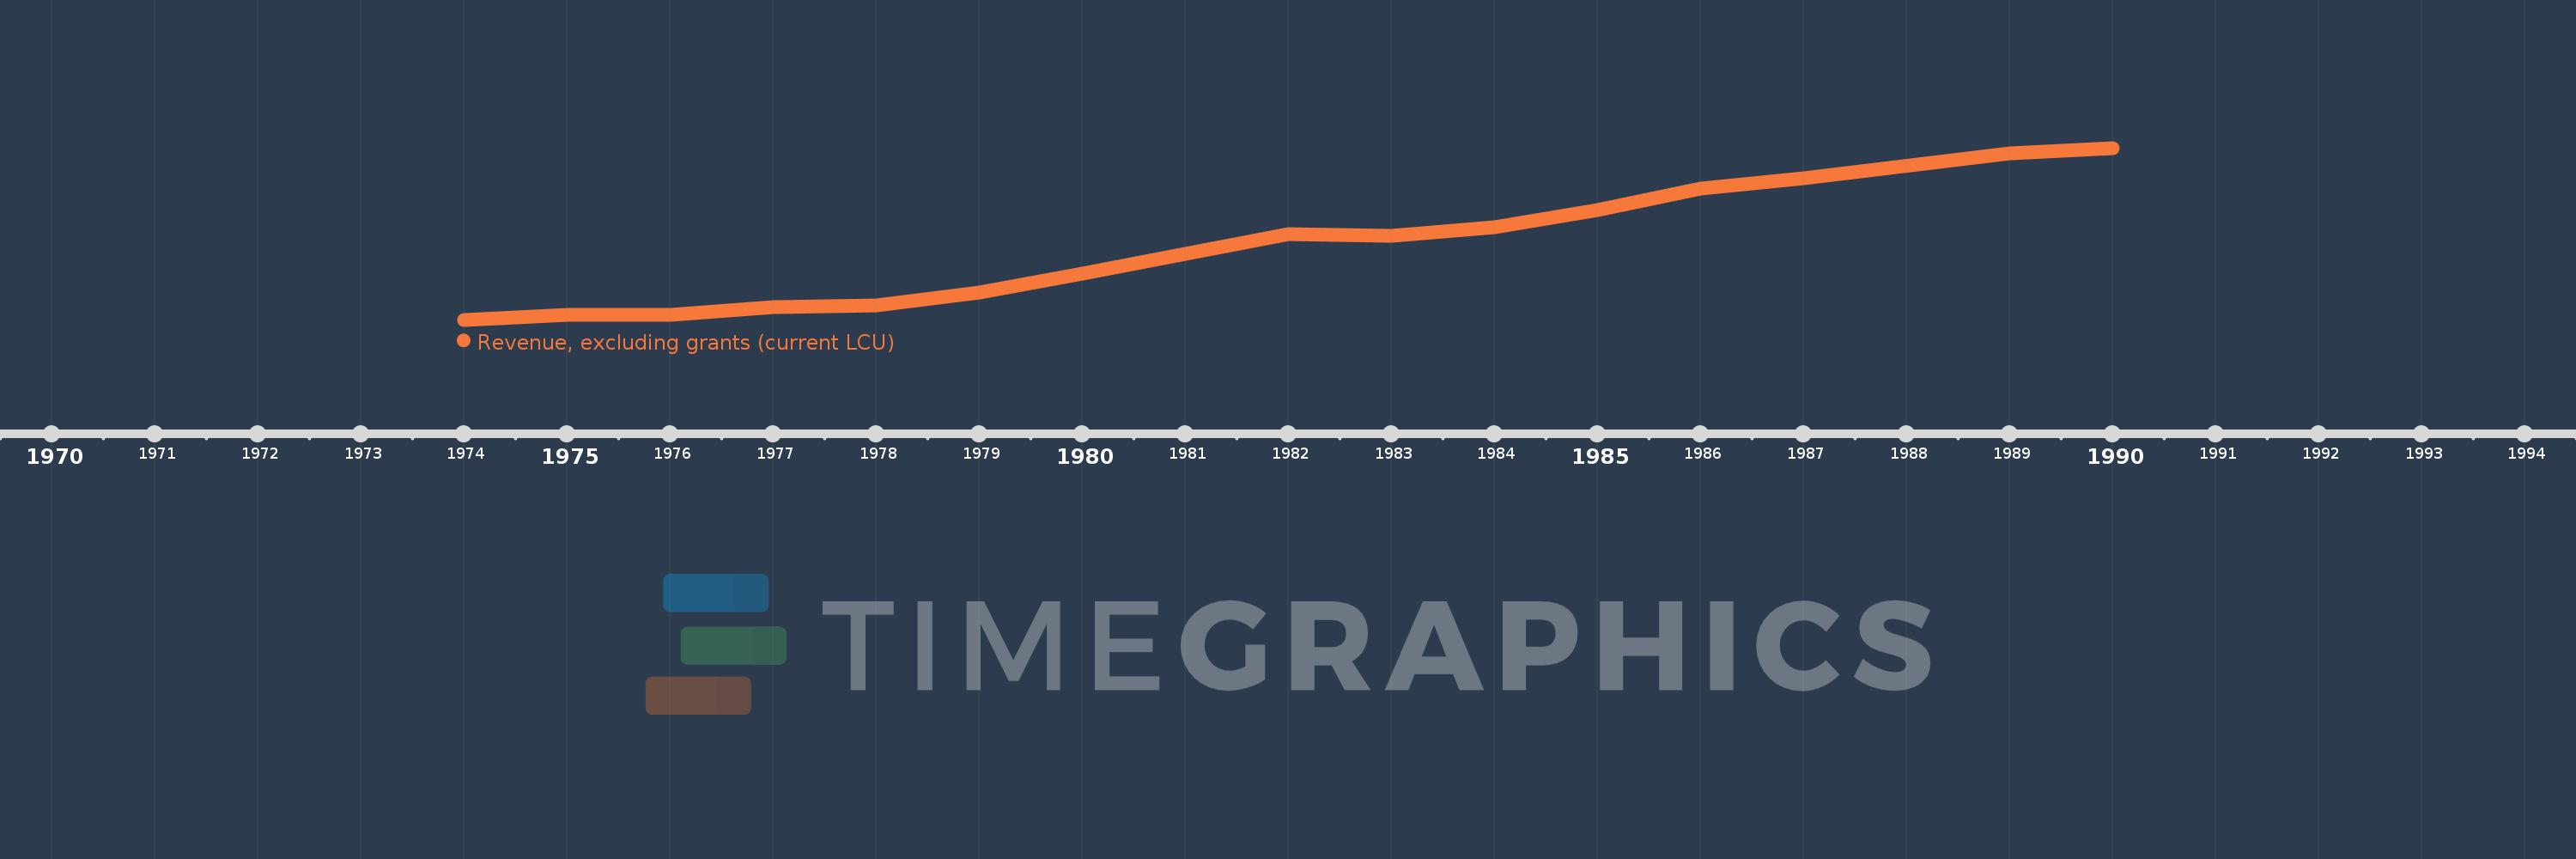
Cette échelle de temps montre un graphique de 1974 année à 1990 année Bahamas, The. Les données jusqu'à 1973 année ne sont pas présentés. Quantité d'observations actuelles selon dates: 16.

Source (désignation):

Les indicateurs du développement mondiale

Source (organisation):

International Monetary Fund, Government Finance Statistics Yearbook and data files.

Catégories:

Public Sector

Dernière mise à jour

23 avr. 2017

Les indicateurs de changement de valeurs selon les années

En moyenne:
255.075 mln.
Minimum:
107.6 mln.
1 janv. 1974
Maximum:
457.2 mln.
1 janv. 1990
Pour la date d''observation
Valeur
Changement absolu
Le changement par rapport à la valeur précédente
1 janv. 1974
107.6 mln.
+107.6 mln.
0.0%
1 janv. 1975
117.1 mln.
+9.5 mln.
8.83%
1 janv. 1976
118.2 mln.
+1.1 mln.
0.94%
1 janv. 1977
133.3 mln.
+15.1 mln.
12.77%
1 janv. 1978
136.8 mln.
+3.5 mln.
2.63%
1 janv. 1979
163.6 mln.
+26.8 mln.
19.59%
1 janv. 1980
201.4 mln.
+37.8 mln.
23.11%
1 janv. 1981
241.9 mln.
+40.5 mln.
20.11%
1 janv. 1982
281.8 mln.
+39.9 mln.
16.49%
1 janv. 1983
278.1 mln.
-3.7 mln.
-1.31%
1 janv. 1984
295.5 mln.
+17.4 mln.
6.26%
1 janv. 1985
331.1 mln.
+35.6 mln.
12.05%
1 janv. 1986
375.1 mln.
+44.0 mln.
13.29%
1 janv. 1987
395.7 mln.
+20.6 mln.
5.49%
1 janv. 1989
446.8 mln.
+51.1 mln.
12.91%
1 janv. 1990
457.2 mln.
+10.4 mln.
2.33%

Classement des pays selon les statistiques actuelles par années