33
/fr/
AIzaSyAYiBZKx7MnpbEhh9jyipgxe19OcubqV5w
August 1, 2025
77581
Bahrain
BHR
true
2
1
Revenue, excluding grants (current LCU)
2014,2012,2011,2010,2009,2008,2007,2006,2005,2004,2003,2002,2001,2000,1999,1998,1997,1996,1995,1994,1993,1992,1991
Download
Bibliothèque de statistiques globales →Bahrain →

Revenue, excluding grants (current LCU)

Cette statistique dans les autres pays:

AfghanistanAlbaniaAlgeriaAngolaAntigua and BarbudaArgentinaArmeniaAustraliaAustriaAzerbaijanBahamas, TheBahrainBangladeshBarbadosBelarusBelgiumBelizeBeninBhutanBoliviaBosnia and HerzegovinaBotswanaBrazilBulgariaBurkina FasoBurundiCabo VerdeCambodiaCanadaCentral African RepublicChileChinaColombiaCongo, Dem. Rep.Congo, Rep.Costa RicaCote d'IvoireCroatiaCyprusCzech RepublicDenmarkDominicaDominican RepublicEgypt, Arab Rep.El SalvadorEquatorial GuineaEstoniaEthiopiaFijiFinlandFranceGambia, TheGeorgiaGermanyGhanaGreeceGrenadaGuatemalaHondurasHong Kong SAR, ChinaHungaryIcelandIndiaIndonesiaIran, Islamic Rep.IraqIrelandIsraelItalyJamaicaJapanJordanKazakhstanKenyaKiribatiKorea, Rep.KuwaitKyrgyz RepublicLao PDRLatviaLebanonLesothoLiberiaLithuaniaLuxembourgMacao SAR, ChinaMacedonia, FYRMadagascarMalawiMalaysiaMaldivesMaliMaltaMauritiusMexicoMicronesia, Fed. Sts.MoldovaMongoliaMoroccoMozambiqueMyanmarNamibiaNepalNetherlandsNew ZealandNicaraguaNigeriaNorwayOmanPakistanPanamaPapua New GuineaParaguayPeruPhilippinesPolandPortugalQatarRomaniaRussian FederationRwandaSamoaSan MarinoSao Tome and PrincipeSenegalSerbiaSeychellesSierra LeoneSingaporeSlovak RepublicSloveniaSolomon IslandsSouth AfricaSpainSri LankaSt. Kitts and NevisSt. LuciaSt. Vincent and the GrenadinesSurinameSwazilandSwedenSwitzerlandSyrian Arab RepublicTajikistanTanzaniaThailandTimor-LesteTogoTrinidad and TobagoTunisiaTurkeyUgandaUkraineUnited Arab EmiratesUnited KingdomUnited StatesUruguayVanuatuVenezuela, RBVietnamWest Bank and GazaYemen, Rep.ZambiaZimbabwe

La ligne de temps

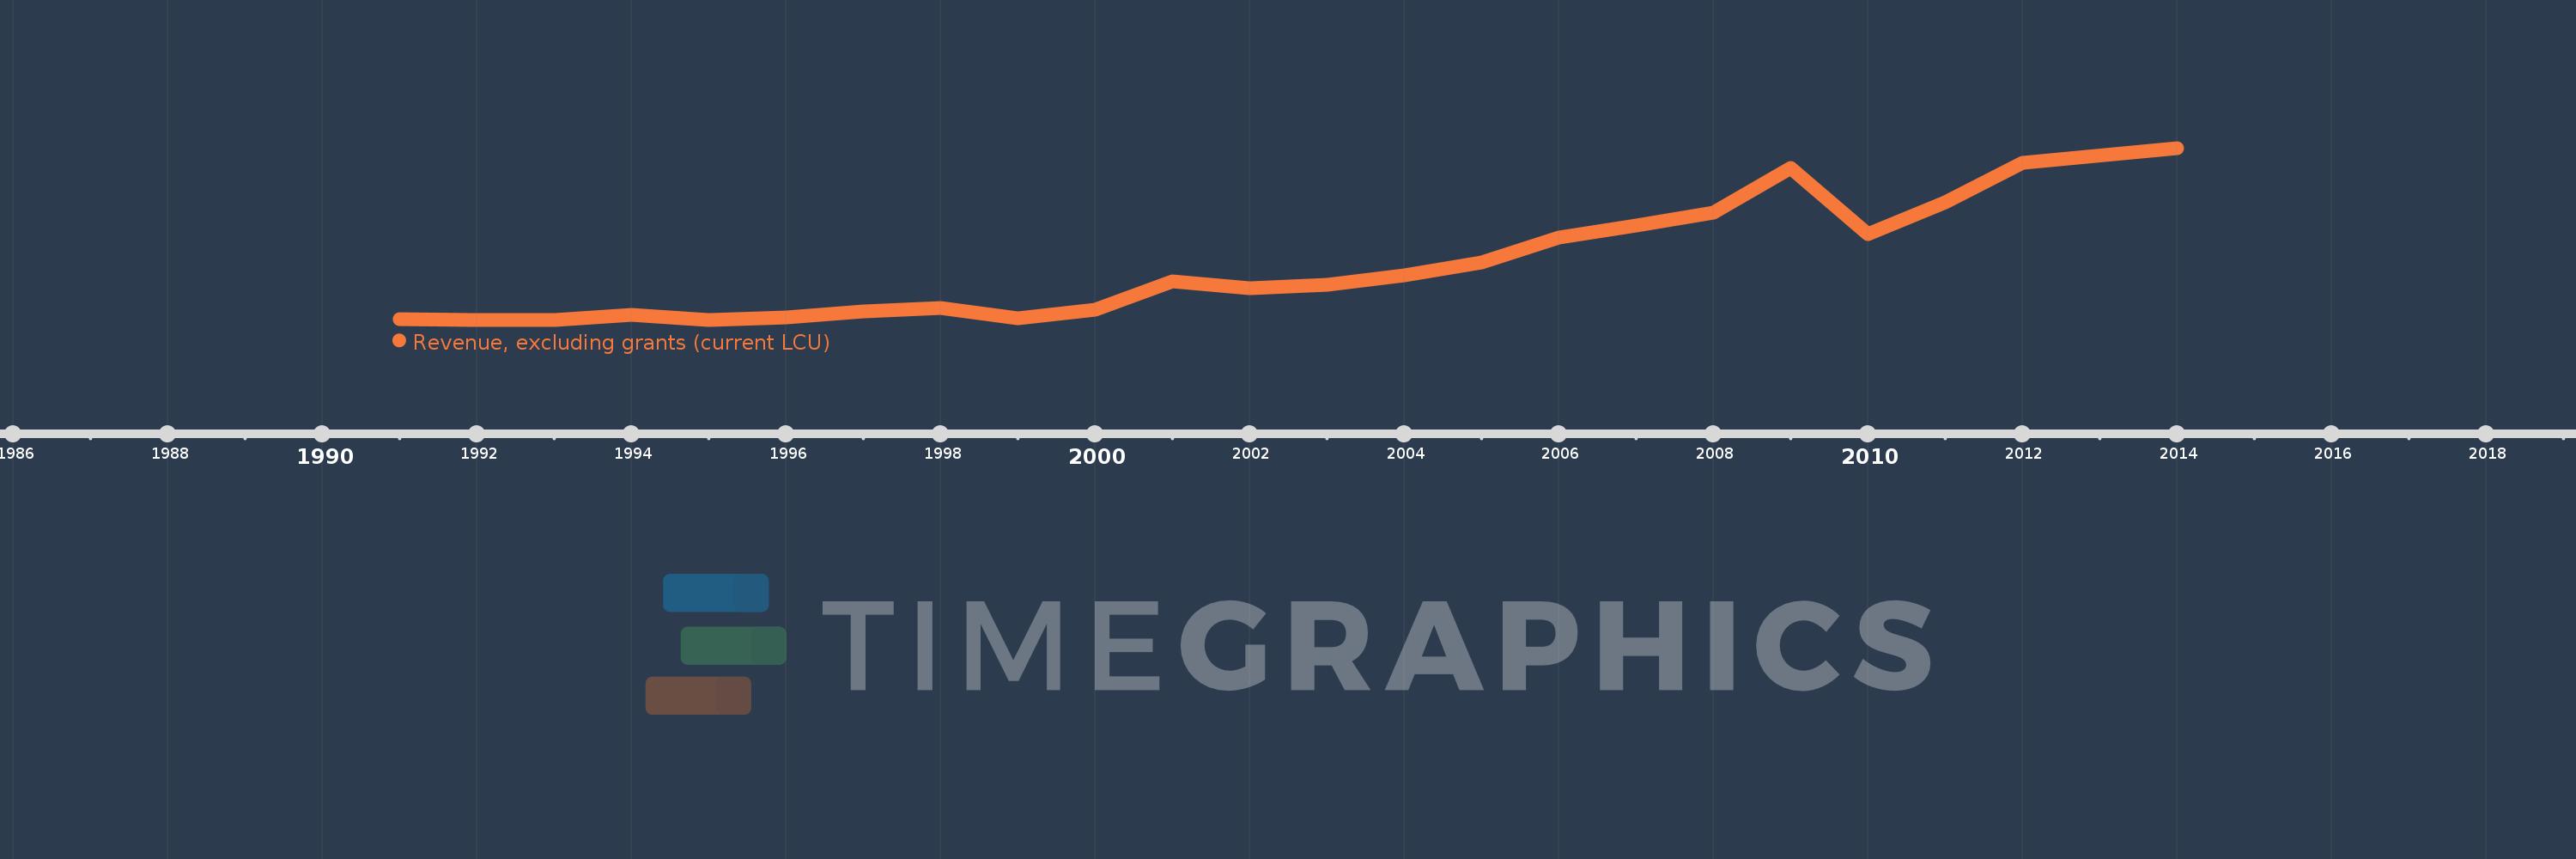
Cette échelle de temps montre un graphique de 1991 année à 2014 année Bahrain. Les données jusqu'à 1990 année ne sont pas présentés. Quantité d'observations actuelles selon dates: 23.

Source (désignation):

Les indicateurs du développement mondiale

Source (organisation):

International Monetary Fund, Government Finance Statistics Yearbook and data files.

Catégories:

Public Sector

Dernière mise à jour

23 avr. 2017

Les indicateurs de changement de valeurs selon les années

En moyenne:
1.199 mds
Minimum:
427.2 mln.
1 janv. 1993
Maximum:
2.942 mds
1 janv. 2014
Pour la date d''observation
Valeur
Changement absolu
Le changement par rapport à la valeur précédente
1 janv. 1991
431.0 mln.
+431.0 mln.
0.0%
1 janv. 1992
428.9 mln.
-2.1 mln.
-0.49%
1 janv. 1993
427.2 mln.
-1.7 mln.
-0.4%
1 janv. 1994
497.5 mln.
+70.3 mln.
16.46%
1 janv. 1995
429.6 mln.
-67.9 mln.
-13.65%
1 janv. 1996
462.3 mln.
+32.7 mln.
7.61%
1 janv. 1997
550.8 mln.
+88.5 mln.
19.14%
1 janv. 1998
600.1 mln.
+49.3 mln.
8.95%
1 janv. 1999
444.1 mln.
-156.0 mln.
-26.0%
1 janv. 2000
575.6 mln.
+131.5 mln.
29.61%
1 janv. 2001
984.5 mln.
+408.9 mln.
71.04%
1 janv. 2002
892.3 mln.
-92.2 mln.
-9.37%
1 janv. 2003
934.7 mln.
+42.4 mln.
4.75%
1 janv. 2004
1.071 mds
+136.3 mln.
14.58%
1 janv. 2005
1.262 mds
+191.1 mln.
17.84%
1 janv. 2006
1.632 mds
+369.58 mln.
29.28%
1 janv. 2007
1.811 mds
+179.66 mln.
11.01%
1 janv. 2008
2.001 mds
+189.449 mln.
10.46%
1 janv. 2009
2.648 mds
+647.391 mln.
32.36%
1 janv. 2010
1.68 mds
-968.61 mln.
-36.58%
1 janv. 2011
2.147 mds
+467.44 mln.
27.83%
1 janv. 2012
2.719 mds
+572.13 mln.
26.65%
1 janv. 2014
2.942 mds
+222.36 mln.
8.18%

Classement des pays selon les statistiques actuelles par années