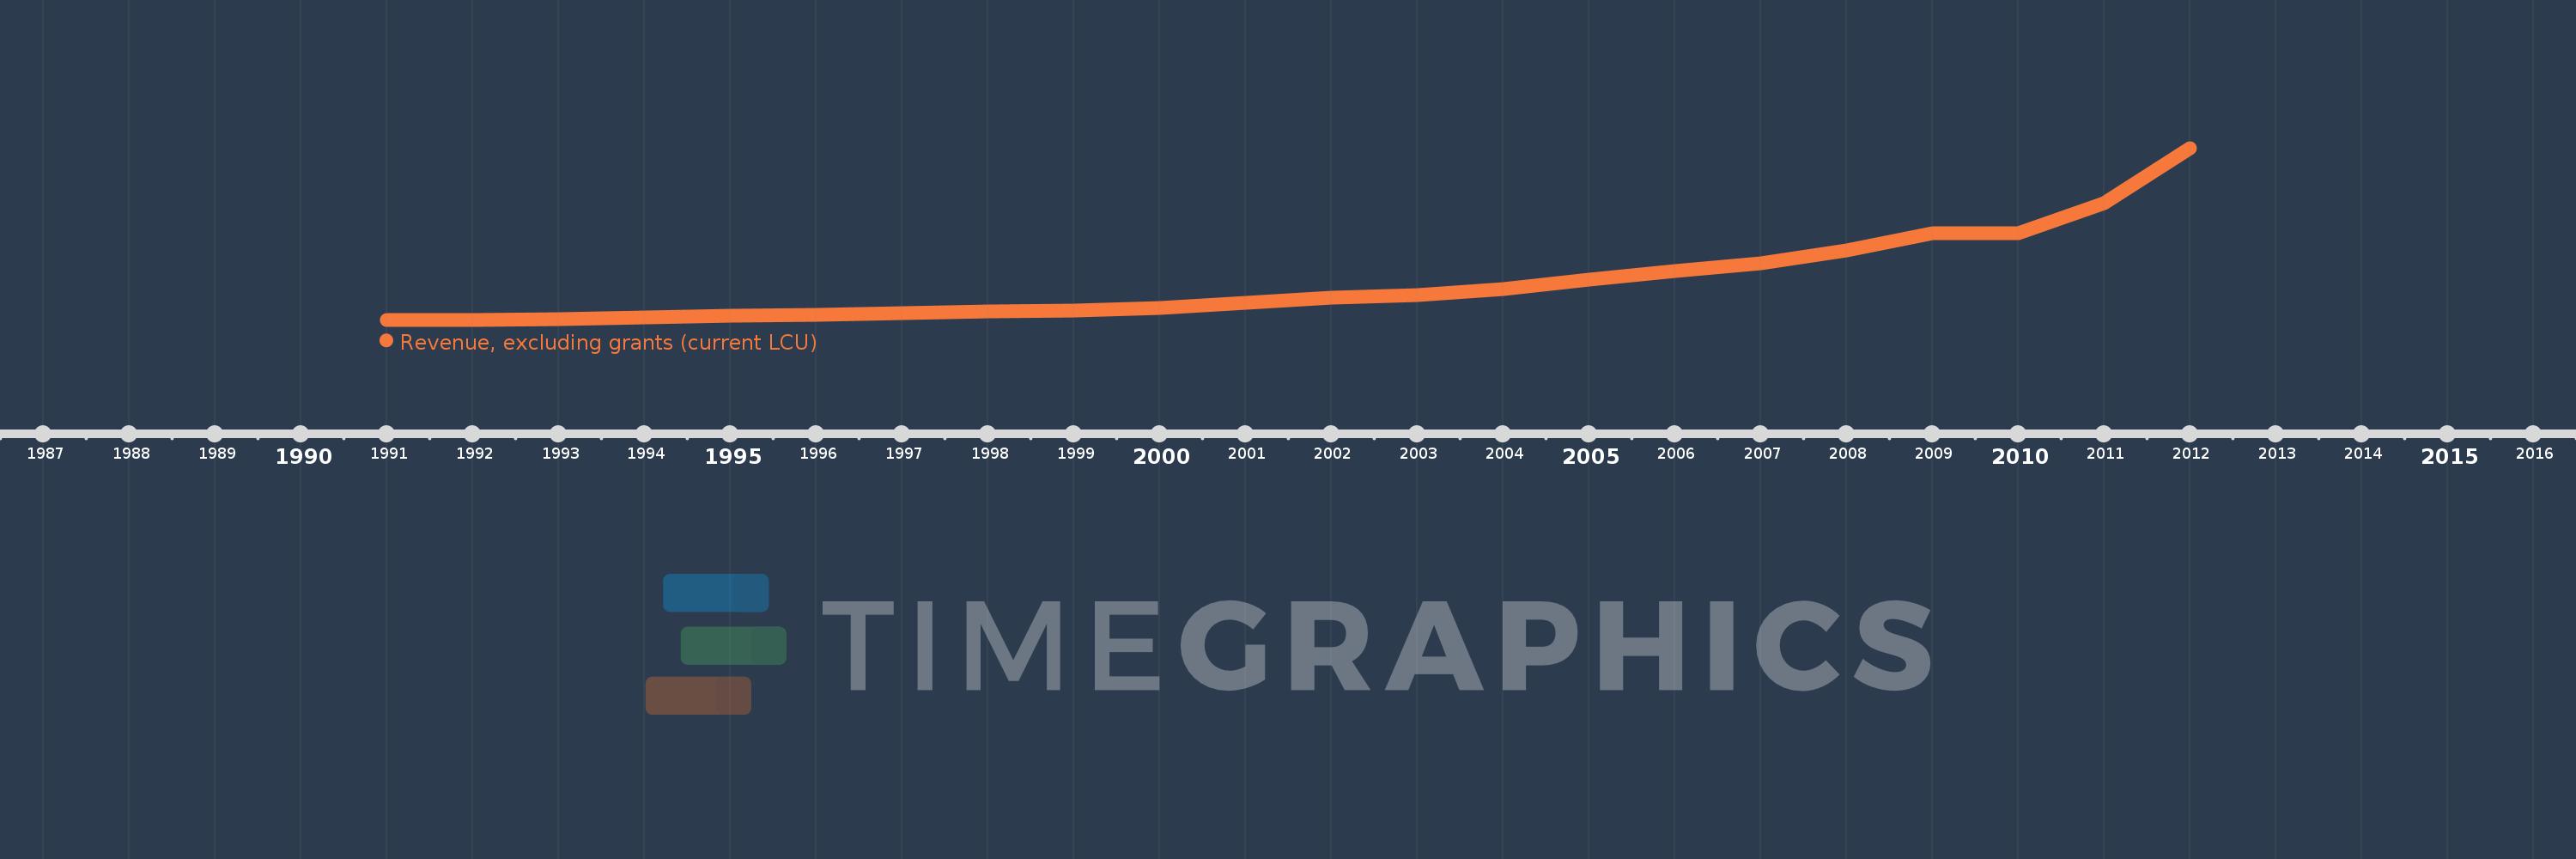
Cette échelle de temps montre un graphique de 1991 année à 2012 année Zambia. Les données jusqu'à 1990 année ne sont pas présentés. Quantité d'observations actuelles selon dates: 21.
Source (désignation):
Les indicateurs du développement mondiale
Source (organisation):
International Monetary Fund, Government Finance Statistics Yearbook and data files.
Catégories:
Public Sector
Dernière mise à jour
23 avr. 2017
Les indicateurs de changement de valeurs selon les années
En moyenne:
4.444 mds
Minimum:
23.13 mln.
1 janv. 1991
Maximum:
19.94 mds
1 janv. 2012
Pour la date d''observation
Valeur
Changement absolu
Le changement par rapport à la valeur précédente
1 janv. 1991
23.13 mln.
+23.13 mln.
0.0%
1 janv. 1992
41.505 mln.
+18.375 mln.
79.44%
1 janv. 1993
113.488 mln.
+71.983 mln.
173.43%
1 janv. 1994
266.213 mln.
+152.724 mln.
134.57%
1 janv. 1995
468.257 mln.
+202.044 mln.
75.9%
1 janv. 1996
600.678 mln.
+132.421 mln.
28.28%
1 janv. 1997
745.1 mln.
+144.422 mln.
24.04%
1 janv. 1998
945.3 mln.
+200.2 mln.
26.87%
1 janv. 1999
1.097 mds
+152.1 mln.
16.09%
1 janv. 2000
1.43 mds
+332.8 mln.
30.33%
1 janv. 2002
2.581 mds
+1.151 mds
80.45%
1 janv. 2003
2.903 mds
+321.874 mln.
12.47%
1 janv. 2004
3.558 mds
+655.252 mln.
22.57%
1 janv. 2005
4.672 mds
+1.114 mds
31.32%
1 janv. 2006
5.652 mds
+979.58 mln.
20.97%
1 janv. 2007
6.542 mds
+890.346 mln.
15.75%
1 janv. 2008
8.037 mds
+1.494 mds
22.84%
1 janv. 2009
10.073 mds
+2.036 mds
25.33%
1 janv. 2010
10.097 mds
+24.626 mln.
0.24%
1 janv. 2011
13.532 mds
+3.435 mds
34.02%
1 janv. 2012
19.94 mds
+6.408 mds
47.35%
Classement des pays selon les statistiques actuelles par années