33
/fr/
AIzaSyAYiBZKx7MnpbEhh9jyipgxe19OcubqV5w
August 1, 2025
248806
Sri Lanka
LKA
true
2
1
High-technology exports (current US$)
2016,2015,2014,2013,2012,2011,2010,2009,2008,2007,2006,2005,2004,2003,2002,2001,2000,1995,1994,1993,1992,1991
Download
Bibliothèque de statistiques globales →Sri Lanka →

High-technology exports (current US$)

Cette statistique dans les autres pays:

AlbaniaAlgeriaAndorraAntigua and BarbudaArab WorldArgentinaArmeniaArubaAustraliaAustriaAzerbaijanBahamas, TheBahrainBangladeshBarbadosBelarusBelgiumBelizeBeninBermudaBhutanBoliviaBosnia and HerzegovinaBotswanaBrazilBrunei DarussalamBulgariaBurkina FasoBurundiCabo VerdeCambodiaCameroonCanadaCaribbean small statesCentral African RepublicCentral Europe and the BalticsChileChinaColombiaComorosCongo, Rep.Costa RicaCote d'IvoireCroatiaCubaCyprusCzech RepublicDenmarkDjiboutiDominicaDominican RepublicEarly-demographic dividendEast Asia & PacificEcuadorEgypt, Arab Rep.El SalvadorEritreaEstoniaEthiopiaEuro areaEurope & Central AsiaEurope & Central Asia (excluding high income)Europe & Central Asia (IDA & IBRD countries)European UnionFaroe IslandsFijiFinlandFranceFrench PolynesiaGabonGambia, TheGeorgiaGermanyGhanaGreeceGreenlandGrenadaGuatemalaGuineaGuinea-BissauGuyanaHaitiHeavily indebted poor countries (HIPC)High incomeHondurasHong Kong SAR, ChinaHungaryIBRD onlyIcelandIDA & IBRD totalIDA blendIDA onlyIDA totalIndiaIndonesiaIran, Islamic Rep.IraqIrelandIsraelItalyJamaicaJapanJordanKazakhstanKenyaKiribatiKorea, Rep.KuwaitKyrgyz RepublicLate-demographic dividendLatin America & Caribbean Latin America & Caribbean (excluding high income)Latin America & the Caribbean (IDA & IBRD countries)LatviaLebanonLesothoLithuaniaLow & middle incomeLow incomeLower middle incomeLuxembourgMacao SAR, ChinaMacedonia, FYRMadagascarMalawiMalaysiaMaldivesMaliMaltaMauritiusMexicoMiddle East & North AfricaMiddle East & North Africa (excluding high income)Middle East & North Africa (IDA & IBRD countries)Middle incomeMoldovaMongoliaMontenegroMoroccoMozambiqueMyanmarNamibiaNepalNetherlandsNew CaledoniaNew ZealandNicaraguaNigerNigeriaNorth AmericaNorwayOECD membersOmanOther small statesPakistanPalauPanamaPapua New GuineaParaguayPeruPhilippinesPolandPortugalPost-demographic dividendQatarRomaniaRussian FederationRwandaSamoaSao Tome and PrincipeSaudi ArabiaSenegalSerbiaSeychellesSierra LeoneSingaporeSlovak RepublicSloveniaSmall statesSolomon IslandsSouth AfricaSouth AsiaSouth Asia (IDA & IBRD)South SudanSpainSri LankaSt. Kitts and NevisSt. LuciaSt. Vincent and the GrenadinesSub-Saharan Africa Sub-Saharan Africa (excluding high income)Sub-Saharan Africa (IDA & IBRD countries)SudanSurinameSwazilandSwedenSwitzerlandSyrian Arab RepublicTajikistanTanzaniaThailandTimor-LesteTogoTongaTrinidad and TobagoTunisiaTurkeyTurkmenistanTurks and Caicos IslandsTuvaluUgandaUkraineUnited Arab EmiratesUnited KingdomUnited StatesUpper middle incomeUruguayVanuatuVenezuela, RBVietnamWest Bank and GazaWorldYemen, Rep.ZambiaZimbabwe

La ligne de temps

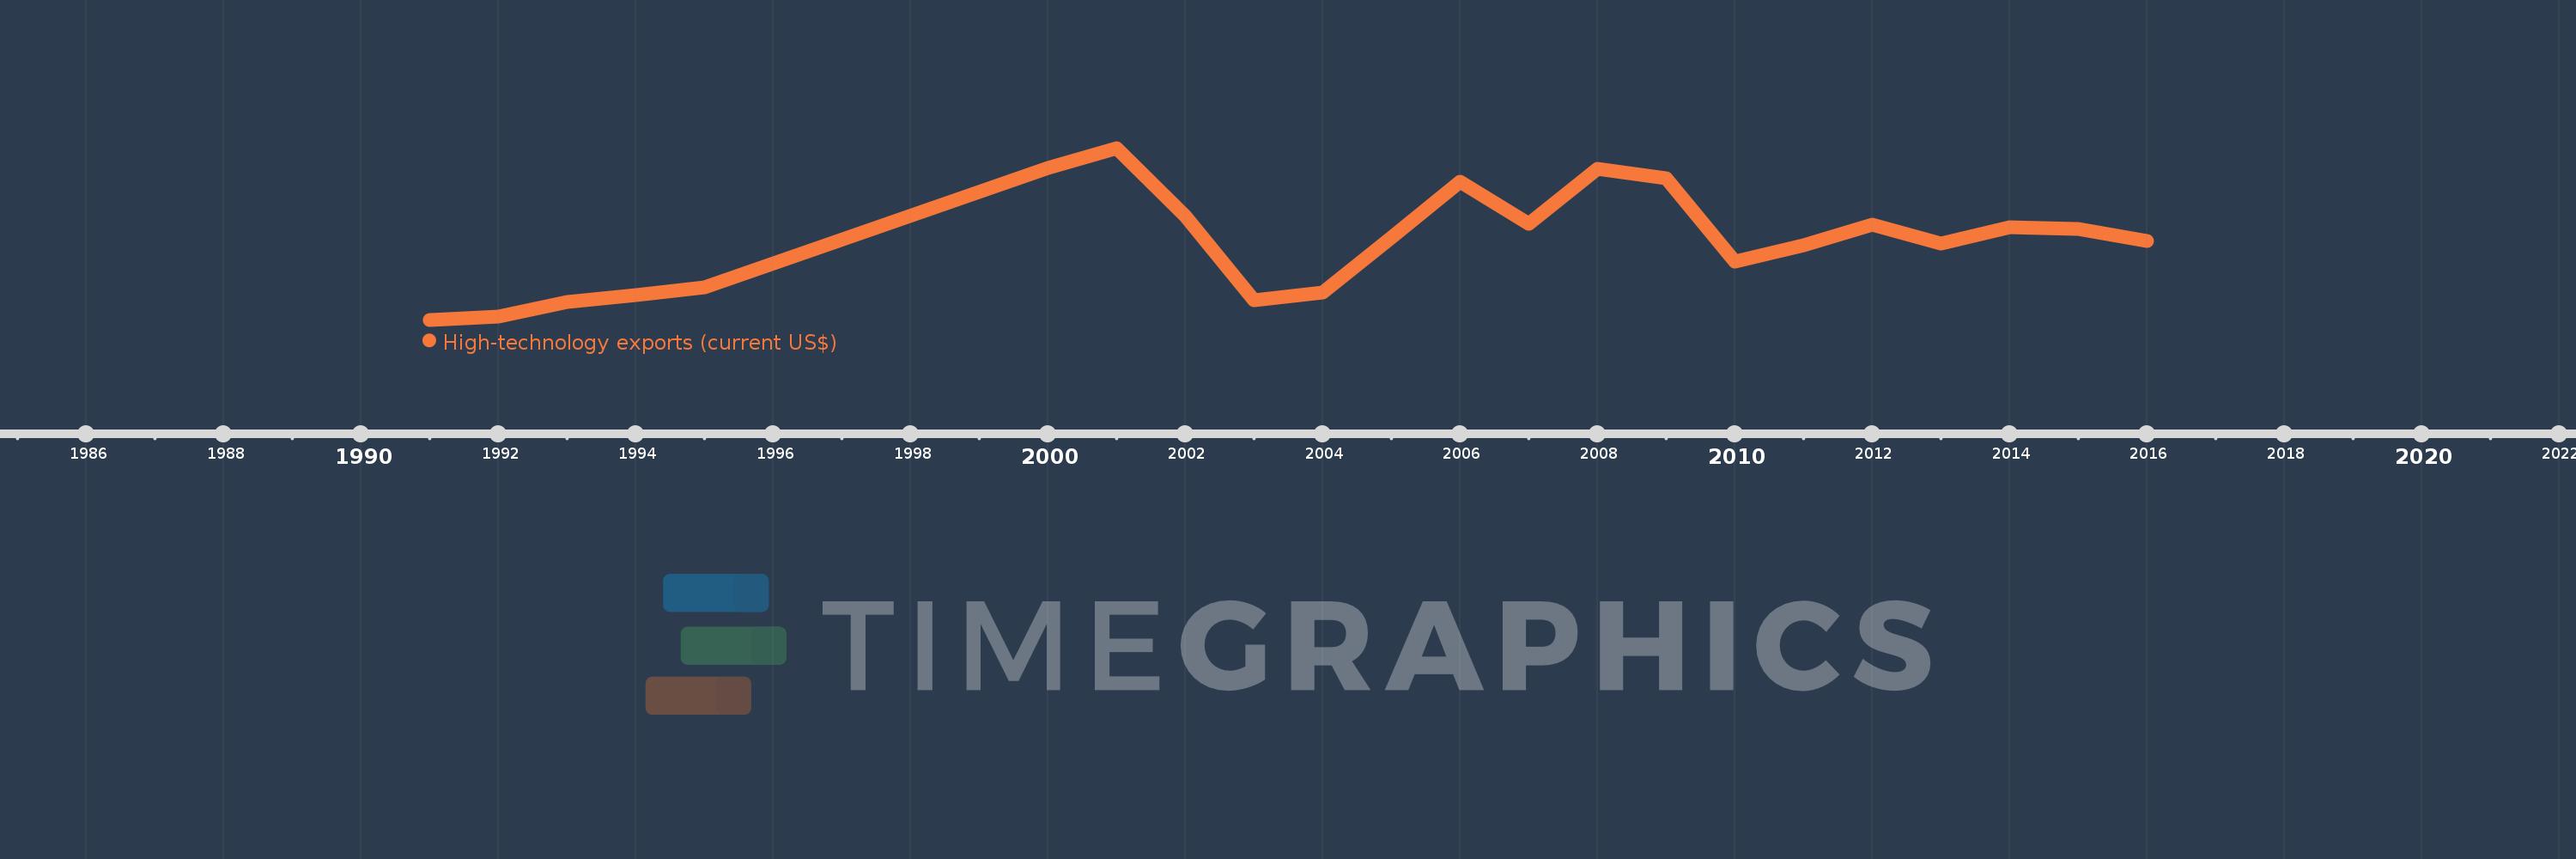
Cette échelle de temps montre un graphique de 1991 année à 2016 année Sri Lanka. Les données jusqu'à 1990 année ne sont pas présentés. Quantité d'observations actuelles selon dates: 22.

Source (désignation):

Les indicateurs du développement mondiale

Source (organisation):

United Nations, Comtrade database.

Catégories:

Private Sector, Science & Technology, Trade

Dernière mise à jour

23 avr. 2017

Les indicateurs de changement de valeurs selon les années

En moyenne:
59.354 mln.
Minimum:
6.056 mln.
1 janv. 1991
Maximum:
122.747 mln.
1 janv. 2001
Pour la date d''observation
Valeur
Changement absolu
Le changement par rapport à la valeur précédente
1 janv. 1991
6.056 mln.
+6.056 mln.
0.0%
1 janv. 1992
8.04 mln.
+1.984 mln.
32.75%
1 janv. 1993
18.181 mln.
+10.141 mln.
126.12%
1 janv. 1994
22.901 mln.
+4.72 mln.
25.96%
1 janv. 1995
27.889 mln.
+4.989 mln.
21.78%
1 janv. 2000
109.039 mln.
+81.15 mln.
290.97%
1 janv. 2001
122.747 mln.
+13.708 mln.
12.57%
1 janv. 2002
76.287 mln.
-46.459 mln.
-37.85%
1 janv. 2003
19.282 mln.
-57.005 mln.
-74.72%
1 janv. 2004
24.62 mln.
+5.338 mln.
27.68%
1 janv. 2005
61.775 mln.
+37.156 mln.
150.92%
1 janv. 2006
99.738 mln.
+37.963 mln.
61.45%
1 janv. 2007
71.512 mln.
-28.226 mln.
-28.3%
1 janv. 2008
108.639 mln.
+37.127 mln.
51.92%
1 janv. 2009
102.24 mln.
-6.4 mln.
-5.89%
1 janv. 2010
45.503 mln.
-56.737 mln.
-55.49%
1 janv. 2011
56.678 mln.
+11.176 mln.
24.56%
1 janv. 2012
70.746 mln.
+14.068 mln.
24.82%
1 janv. 2013
57.824 mln.
-12.923 mln.
-18.27%
1 janv. 2014
69.143 mln.
+11.319 mln.
19.57%
1 janv. 2015
67.648 mln.
-1.495 mln.
-2.16%
1 janv. 2016
59.295 mln.
-8.353 mln.
-12.35%

Classement des pays selon les statistiques actuelles par années