33
/fr/
AIzaSyAYiBZKx7MnpbEhh9jyipgxe19OcubqV5w
May 1, 2025
144464
Guatemala
GTM
true
2
1
High-technology exports (current US$)
2016,2015,2014,2013,2012,2011,2010,2009,2008,2007,2006,2005,2004,2003,2002,2001,2000,1999,1998,1997,1996,1995,1994
Download
Bibliothèque de statistiques globales →Guatemala →

High-technology exports (current US$)

Cette statistique dans les autres pays:

AlbaniaAlgeriaAndorraAntigua and BarbudaArab WorldArgentinaArmeniaArubaAustraliaAustriaAzerbaijanBahamas, TheBahrainBangladeshBarbadosBelarusBelgiumBelizeBeninBermudaBhutanBoliviaBosnia and HerzegovinaBotswanaBrazilBrunei DarussalamBulgariaBurkina FasoBurundiCabo VerdeCambodiaCameroonCanadaCaribbean small statesCentral African RepublicCentral Europe and the BalticsChileChinaColombiaComorosCongo, Rep.Costa RicaCote d'IvoireCroatiaCubaCyprusCzech RepublicDenmarkDjiboutiDominicaDominican RepublicEarly-demographic dividendEast Asia & PacificEcuadorEgypt, Arab Rep.El SalvadorEritreaEstoniaEthiopiaEuro areaEurope & Central AsiaEurope & Central Asia (excluding high income)Europe & Central Asia (IDA & IBRD countries)European UnionFaroe IslandsFijiFinlandFranceFrench PolynesiaGabonGambia, TheGeorgiaGermanyGhanaGreeceGreenlandGrenadaGuatemalaGuineaGuinea-BissauGuyanaHaitiHeavily indebted poor countries (HIPC)High incomeHondurasHong Kong SAR, ChinaHungaryIBRD onlyIcelandIDA & IBRD totalIDA blendIDA onlyIDA totalIndiaIndonesiaIran, Islamic Rep.IraqIrelandIsraelItalyJamaicaJapanJordanKazakhstanKenyaKiribatiKorea, Rep.KuwaitKyrgyz RepublicLate-demographic dividendLatin America & Caribbean Latin America & Caribbean (excluding high income)Latin America & the Caribbean (IDA & IBRD countries)LatviaLebanonLesothoLithuaniaLow & middle incomeLow incomeLower middle incomeLuxembourgMacao SAR, ChinaMacedonia, FYRMadagascarMalawiMalaysiaMaldivesMaliMaltaMauritiusMexicoMiddle East & North AfricaMiddle East & North Africa (excluding high income)Middle East & North Africa (IDA & IBRD countries)Middle incomeMoldovaMongoliaMontenegroMoroccoMozambiqueMyanmarNamibiaNepalNetherlandsNew CaledoniaNew ZealandNicaraguaNigerNigeriaNorth AmericaNorwayOECD membersOmanOther small statesPakistanPalauPanamaPapua New GuineaParaguayPeruPhilippinesPolandPortugalPost-demographic dividendQatarRomaniaRussian FederationRwandaSamoaSao Tome and PrincipeSaudi ArabiaSenegalSerbiaSeychellesSierra LeoneSingaporeSlovak RepublicSloveniaSmall statesSolomon IslandsSouth AfricaSouth AsiaSouth Asia (IDA & IBRD)South SudanSpainSri LankaSt. Kitts and NevisSt. LuciaSt. Vincent and the GrenadinesSub-Saharan Africa Sub-Saharan Africa (excluding high income)Sub-Saharan Africa (IDA & IBRD countries)SudanSurinameSwazilandSwedenSwitzerlandSyrian Arab RepublicTajikistanTanzaniaThailandTimor-LesteTogoTongaTrinidad and TobagoTunisiaTurkeyTurkmenistanTurks and Caicos IslandsTuvaluUgandaUkraineUnited Arab EmiratesUnited KingdomUnited StatesUpper middle incomeUruguayVanuatuVenezuela, RBVietnamWest Bank and GazaWorldYemen, Rep.ZambiaZimbabwe

La ligne de temps

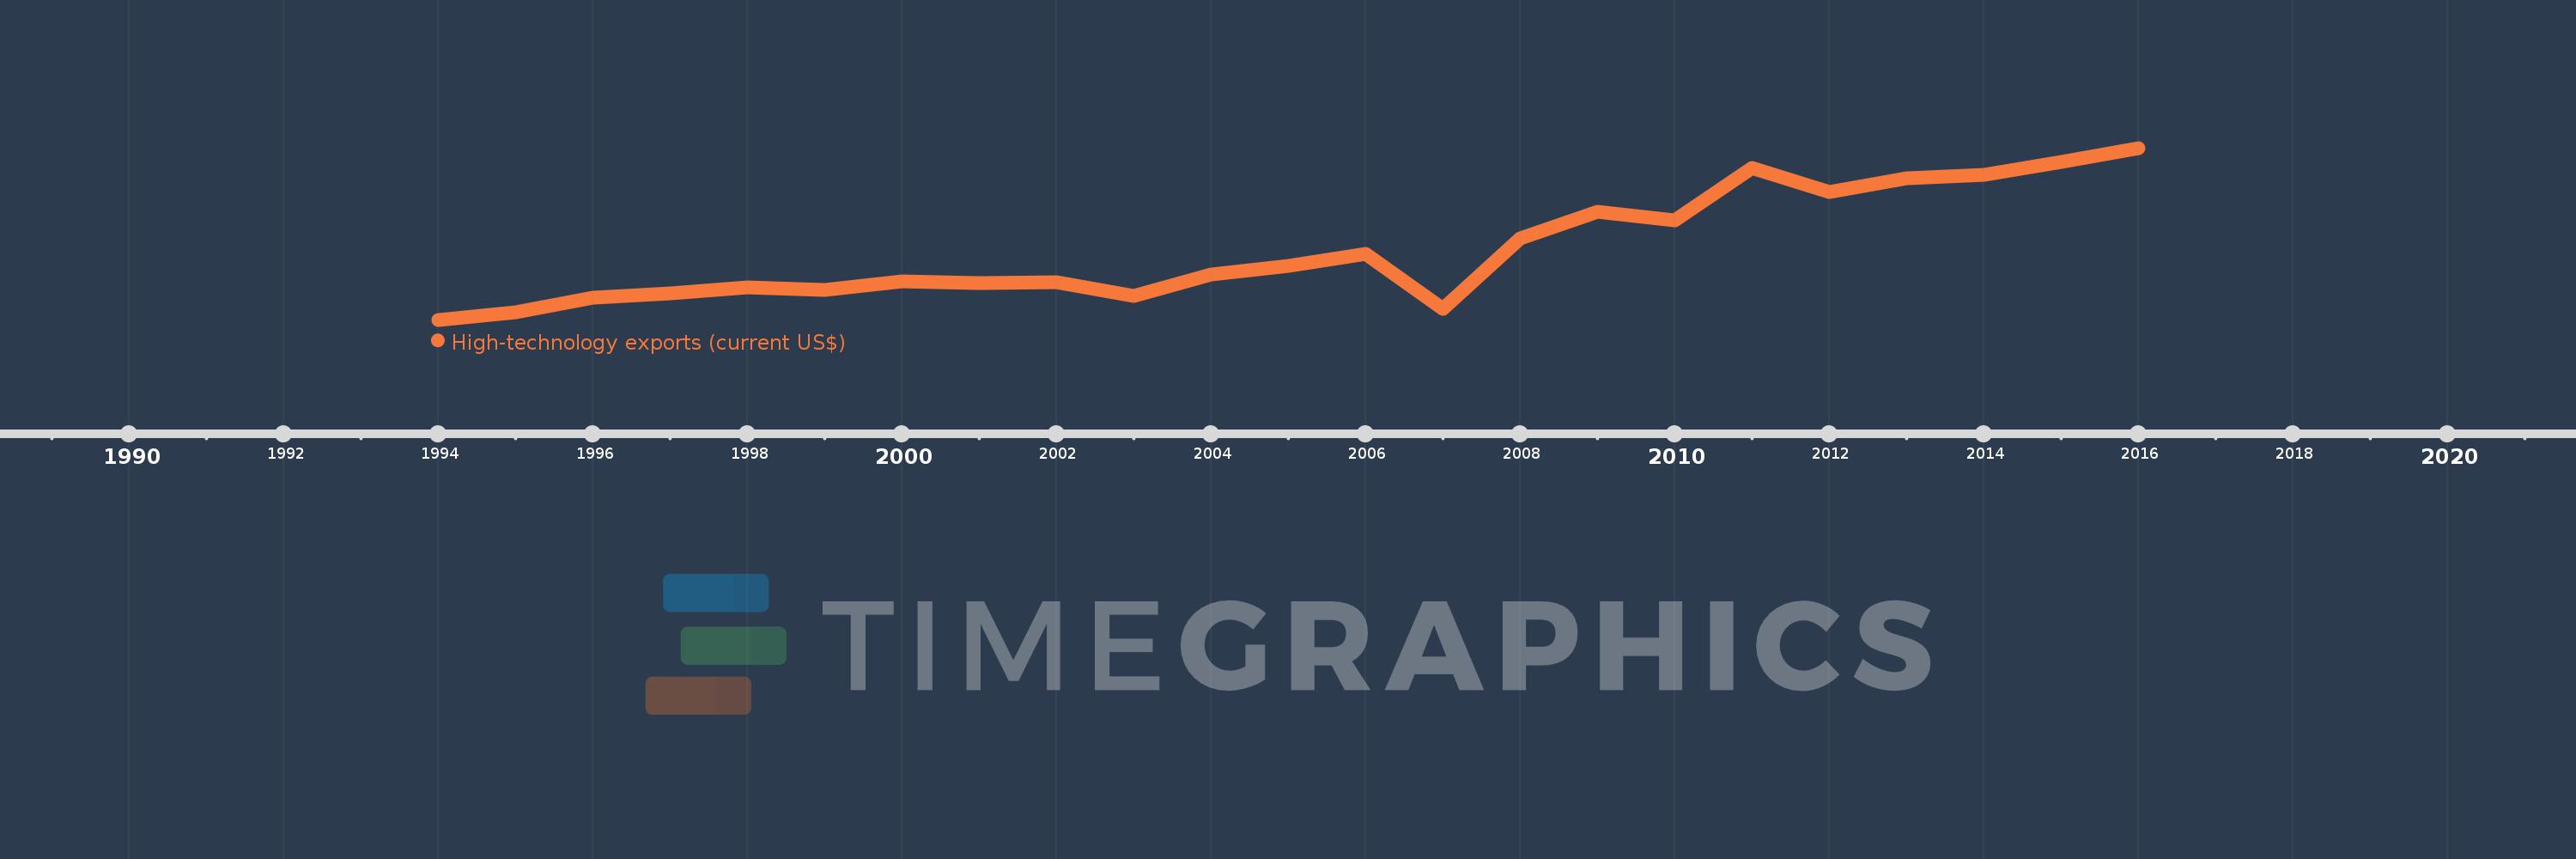
Cette échelle de temps montre un graphique de 1994 année à 2016 année Guatemala. Les données jusqu'à 1993 année ne sont pas présentés. Quantité d'observations actuelles selon dates: 23.

Source (désignation):

Les indicateurs du développement mondiale

Source (organisation):

United Nations, Comtrade database.

Catégories:

Private Sector, Science & Technology, Trade

Dernière mise à jour

23 avr. 2017

Les indicateurs de changement de valeurs selon les années

En moyenne:
108.603 mln.
Minimum:
25.768 mln.
1 janv. 1994
Maximum:
228.466 mln.
1 janv. 2016
Pour la date d''observation
Valeur
Changement absolu
Le changement par rapport à la valeur précédente
1 janv. 1994
25.768 mln.
+25.768 mln.
0.0%
1 janv. 1995
34.338 mln.
+8.57 mln.
33.26%
1 janv. 1996
51.838 mln.
+17.5 mln.
50.96%
1 janv. 1997
57.088 mln.
+5.251 mln.
10.13%
1 janv. 1998
64.421 mln.
+7.333 mln.
12.84%
1 janv. 1999
60.736 mln.
-3.685 mln.
-5.72%
1 janv. 2000
71.341 mln.
+10.605 mln.
17.46%
1 janv. 2001
68.673 mln.
-2.667 mln.
-3.74%
1 janv. 2002
70.297 mln.
+1.624 mln.
2.36%
1 janv. 2003
53.344 mln.
-16.953 mln.
-24.12%
1 janv. 2004
79.615 mln.
+26.271 mln.
49.25%
1 janv. 2005
89.758 mln.
+10.142 mln.
12.74%
1 janv. 2006
103.164 mln.
+13.407 mln.
14.94%
1 janv. 2007
38.409 mln.
-64.756 mln.
-62.77%
1 janv. 2008
122.165 mln.
+83.757 mln.
218.07%
1 janv. 2009
152.702 mln.
+30.537 mln.
25.0%
1 janv. 2010
142.728 mln.
-9.974 mln.
-6.53%
1 janv. 2011
205.085 mln.
+62.357 mln.
43.69%
1 janv. 2012
176.575 mln.
-28.51 mln.
-13.9%
1 janv. 2013
192.51 mln.
+15.935 mln.
9.02%
1 janv. 2014
197.059 mln.
+4.549 mln.
2.36%
1 janv. 2015
211.783 mln.
+14.724 mln.
7.47%
1 janv. 2016
228.466 mln.
+16.683 mln.
7.88%

Classement des pays selon les statistiques actuelles par années