29
/fr/
fr
AIzaSyAYiBZKx7MnpbEhh9jyipgxe19OcubqV5w
April 1, 2024
113675
Cote d'Ivoire
CIV
true
2
1
High-technology exports (current US$)
2016,2015,2014,2013,2012,2011,2010,2009,2008,2007,2006,2005,2004,2003,2002,2001,2000,1999,1998,1997,1996
Download
Bibliothèque de statistiques globales →Cote d'Ivoire →

High-technology exports (current US$)

Cette statistique dans les autres pays:
AlbaniaAlgeriaAndorraAntigua and BarbudaArab WorldArgentinaArmeniaArubaAustraliaAustriaAzerbaijanBahamas, TheBahrainBangladeshBarbadosBelarusBelgiumBelizeBeninBermudaBhutanBoliviaBosnia and HerzegovinaBotswanaBrazilBrunei DarussalamBulgariaBurkina FasoBurundiCabo VerdeCambodiaCameroonCanadaCaribbean small statesCentral African RepublicCentral Europe and the BalticsChileChinaColombiaComorosCongo, Rep.Costa RicaCote d'IvoireCroatiaCubaCyprusCzech RepublicDenmarkDjiboutiDominicaDominican RepublicEarly-demographic dividendEast Asia & PacificEcuadorEgypt, Arab Rep.El SalvadorEritreaEstoniaEthiopiaEuro areaEurope & Central AsiaEurope & Central Asia (excluding high income)Europe & Central Asia (IDA & IBRD countries)European UnionFaroe IslandsFijiFinlandFranceFrench PolynesiaGabonGambia, TheGeorgiaGermanyGhanaGreeceGreenlandGrenadaGuatemalaGuineaGuinea-BissauGuyanaHaitiHeavily indebted poor countries (HIPC)High incomeHondurasHong Kong SAR, ChinaHungaryIBRD onlyIcelandIDA & IBRD totalIDA blendIDA onlyIDA totalIndiaIndonesiaIran, Islamic Rep.IraqIrelandIsraelItalyJamaicaJapanJordanKazakhstanKenyaKiribatiKorea, Rep.KuwaitKyrgyz RepublicLate-demographic dividendLatin America & Caribbean Latin America & Caribbean (excluding high income)Latin America & the Caribbean (IDA & IBRD countries)LatviaLebanonLesothoLithuaniaLow & middle incomeLow incomeLower middle incomeLuxembourgMacao SAR, ChinaMacedonia, FYRMadagascarMalawiMalaysiaMaldivesMaliMaltaMauritiusMexicoMiddle East & North AfricaMiddle East & North Africa (excluding high income)Middle East & North Africa (IDA & IBRD countries)Middle incomeMoldovaMongoliaMontenegroMoroccoMozambiqueMyanmarNamibiaNepalNetherlandsNew CaledoniaNew ZealandNicaraguaNigerNigeriaNorth AmericaNorwayOECD membersOmanOther small statesPakistanPalauPanamaPapua New GuineaParaguayPeruPhilippinesPolandPortugalPost-demographic dividendQatarRomaniaRussian FederationRwandaSamoaSao Tome and PrincipeSaudi ArabiaSenegalSerbiaSeychellesSierra LeoneSingaporeSlovak RepublicSloveniaSmall statesSolomon IslandsSouth AfricaSouth AsiaSouth Asia (IDA & IBRD)South SudanSpainSri LankaSt. Kitts and NevisSt. LuciaSt. Vincent and the GrenadinesSub-Saharan Africa Sub-Saharan Africa (excluding high income)Sub-Saharan Africa (IDA & IBRD countries)SudanSurinameSwazilandSwedenSwitzerlandSyrian Arab RepublicTajikistanTanzaniaThailandTimor-LesteTogoTongaTrinidad and TobagoTunisiaTurkeyTurkmenistanTurks and Caicos IslandsTuvaluUgandaUkraineUnited Arab EmiratesUnited KingdomUnited StatesUpper middle incomeUruguayVanuatuVenezuela, RBVietnamWest Bank and GazaWorldYemen, Rep.ZambiaZimbabwe
La ligne de temps
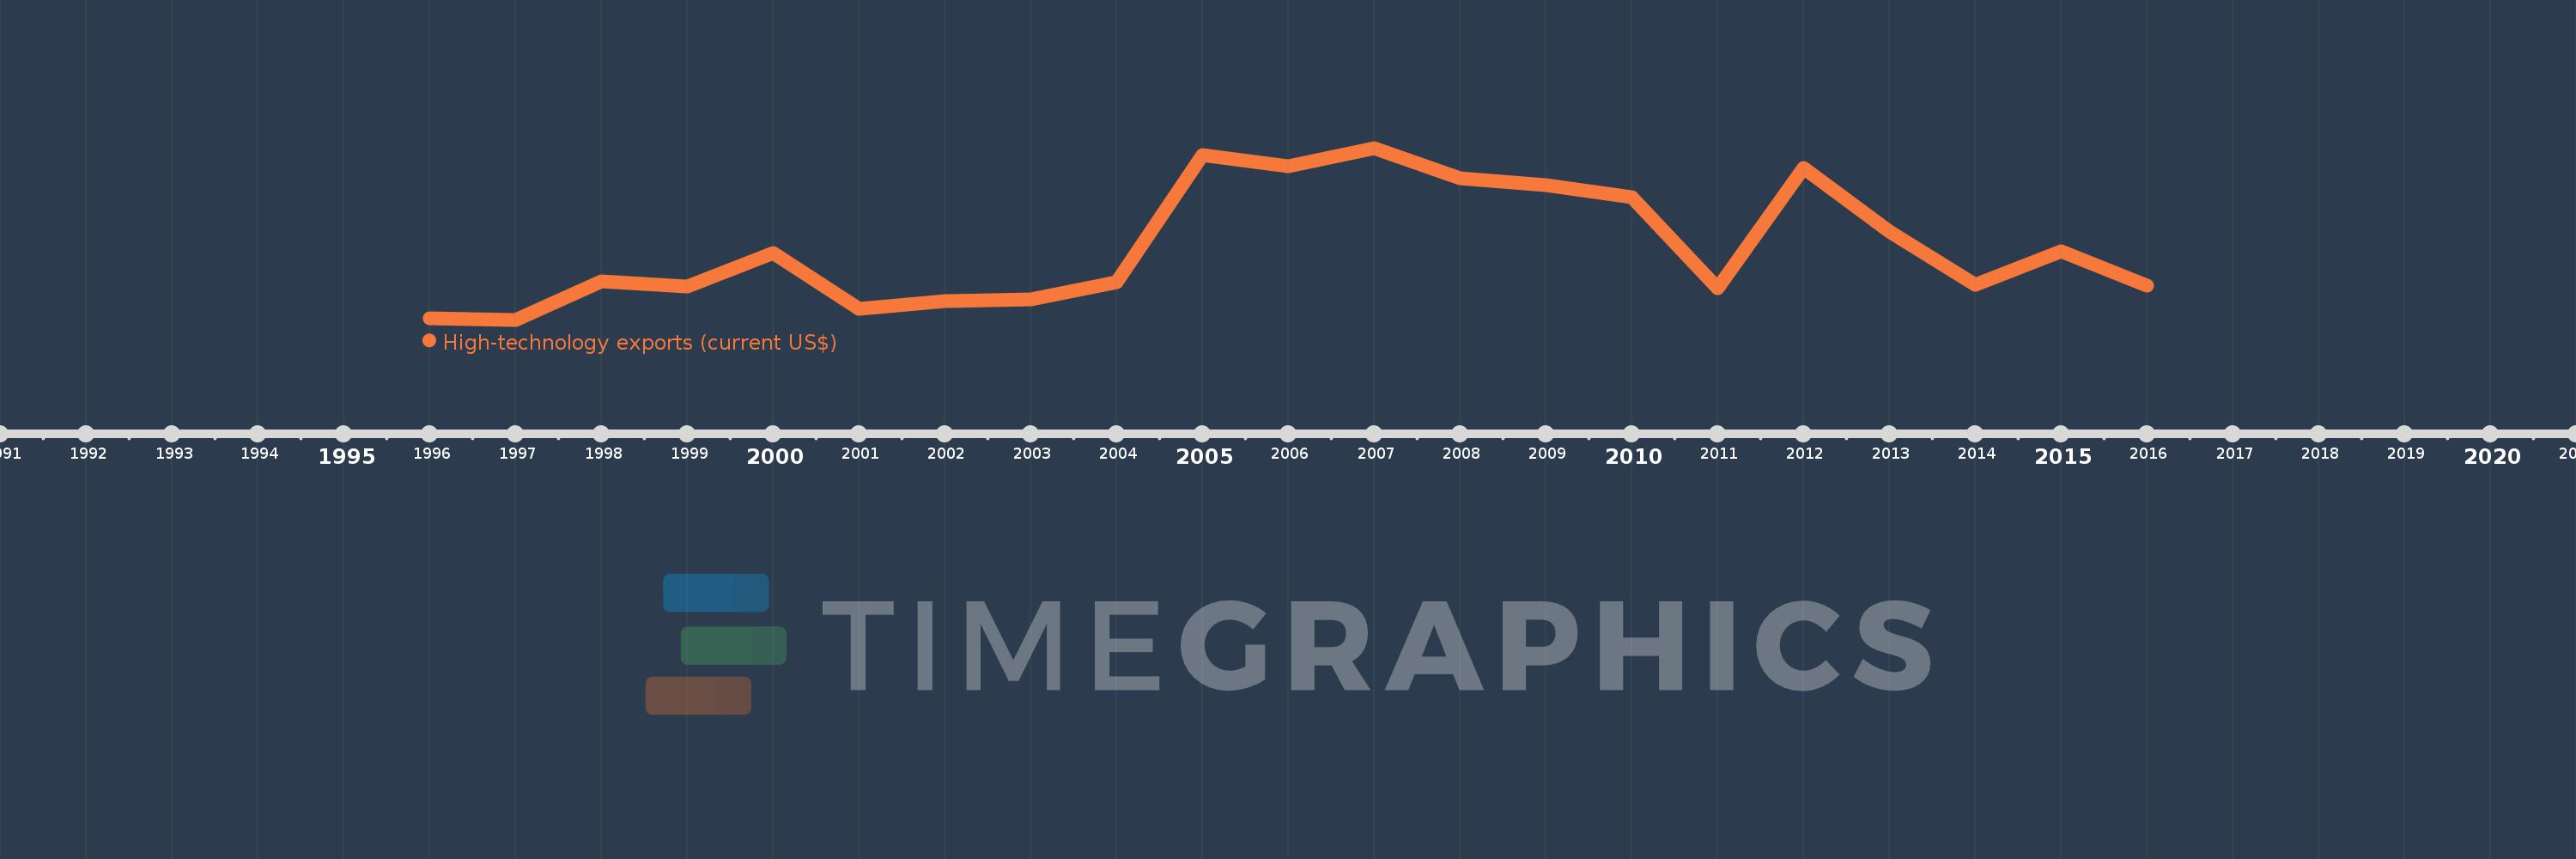
Cette échelle de temps montre un graphique de 1996 année à 2016 année Cote d'Ivoire. Les données jusqu'à 1995 année ne sont pas présentés. Quantité d'observations actuelles selon dates: 21.
Source (désignation):
Les indicateurs du développement mondiale
Source (organisation):
United Nations, Comtrade database.
Catégories:
Private Sector, Science & Technology, Trade
Dernière mise à jour
23 avr. 2017
Les indicateurs de changement de valeurs selon les années
En moyenne:
76.252 mln.
Minimum:
4.016 mln.
1 janv. 1997
Maximum:
174.798 mln.
1 janv. 2007
Pour la date d''observation
Valeur
Changement absolu
Le changement par rapport à la valeur précédente
1 janv. 1996
5.528 mln.
+5.528 mln.
0.0%
1 janv. 1997
4.016 mln.
-1.511 mln.
-27.34%
1 janv. 1998
42.136 mln.
+38.12 mln.
949.09%
1 janv. 1999
37.374 mln.
-4.762 mln.
-11.3%
1 janv. 2000
70.222 mln.
+32.848 mln.
87.89%
1 janv. 2001
14.925 mln.
-55.297 mln.
-78.75%
1 janv. 2002
22.898 mln.
+7.973 mln.
53.42%
1 janv. 2003
24.513 mln.
+1.615 mln.
7.05%
1 janv. 2004
41.554 mln.
+17.041 mln.
69.52%
1 janv. 2005
168.099 mln.
+126.545 mln.
304.53%
1 janv. 2006
156.213 mln.
-11.886 mln.
-7.07%
1 janv. 2007
174.798 mln.
+18.585 mln.
11.9%
1 janv. 2008
145.013 mln.
-29.785 mln.
-17.04%
1 janv. 2009
137.672 mln.
-7.341 mln.
-5.06%
1 janv. 2010
125.504 mln.
-12.168 mln.
-8.84%
1 janv. 2011
35.47 mln.
-90.033 mln.
-71.74%
1 janv. 2012
155.141 mln.
+119.67 mln.
337.38%
1 janv. 2013
91.584 mln.
-63.557 mln.
-40.97%
1 janv. 2014
38.667 mln.
-52.917 mln.
-57.78%
1 janv. 2015
72.379 mln.
+33.712 mln.
87.19%
1 janv. 2016
37.578 mln.
-34.802 mln.
-48.08%
Classement des pays selon les statistiques actuelles par années

Commentaires:

Envoyer
PremiumAbout & FeedbackUn accordConfidentialité
logo
© 2022 Selected Technologies LLC – Morgan Hill, California