29
/fr/
fr
AIzaSyAYiBZKx7MnpbEhh9jyipgxe19OcubqV5w
April 1, 2024
124891
Egypt, Arab Rep.
EGY
true
2
1
High-technology exports (current US$)
2016,2015,2014,2013,2012,2011,2010,2009,2008,2007,2006,2005,2004,2003,2002,2001,2000,1999,1998,1997,1996,1995
Download
Bibliothèque de statistiques globales →Egypt, Arab Rep. →

High-technology exports (current US$)

Cette statistique dans les autres pays:
AlbaniaAlgeriaAndorraAntigua and BarbudaArab WorldArgentinaArmeniaArubaAustraliaAustriaAzerbaijanBahamas, TheBahrainBangladeshBarbadosBelarusBelgiumBelizeBeninBermudaBhutanBoliviaBosnia and HerzegovinaBotswanaBrazilBrunei DarussalamBulgariaBurkina FasoBurundiCabo VerdeCambodiaCameroonCanadaCaribbean small statesCentral African RepublicCentral Europe and the BalticsChileChinaColombiaComorosCongo, Rep.Costa RicaCote d'IvoireCroatiaCubaCyprusCzech RepublicDenmarkDjiboutiDominicaDominican RepublicEarly-demographic dividendEast Asia & PacificEcuadorEgypt, Arab Rep.El SalvadorEritreaEstoniaEthiopiaEuro areaEurope & Central AsiaEurope & Central Asia (excluding high income)Europe & Central Asia (IDA & IBRD countries)European UnionFaroe IslandsFijiFinlandFranceFrench PolynesiaGabonGambia, TheGeorgiaGermanyGhanaGreeceGreenlandGrenadaGuatemalaGuineaGuinea-BissauGuyanaHaitiHeavily indebted poor countries (HIPC)High incomeHondurasHong Kong SAR, ChinaHungaryIBRD onlyIcelandIDA & IBRD totalIDA blendIDA onlyIDA totalIndiaIndonesiaIran, Islamic Rep.IraqIrelandIsraelItalyJamaicaJapanJordanKazakhstanKenyaKiribatiKorea, Rep.KuwaitKyrgyz RepublicLate-demographic dividendLatin America & Caribbean Latin America & Caribbean (excluding high income)Latin America & the Caribbean (IDA & IBRD countries)LatviaLebanonLesothoLithuaniaLow & middle incomeLow incomeLower middle incomeLuxembourgMacao SAR, ChinaMacedonia, FYRMadagascarMalawiMalaysiaMaldivesMaliMaltaMauritiusMexicoMiddle East & North AfricaMiddle East & North Africa (excluding high income)Middle East & North Africa (IDA & IBRD countries)Middle incomeMoldovaMongoliaMontenegroMoroccoMozambiqueMyanmarNamibiaNepalNetherlandsNew CaledoniaNew ZealandNicaraguaNigerNigeriaNorth AmericaNorwayOECD membersOmanOther small statesPakistanPalauPanamaPapua New GuineaParaguayPeruPhilippinesPolandPortugalPost-demographic dividendQatarRomaniaRussian FederationRwandaSamoaSao Tome and PrincipeSaudi ArabiaSenegalSerbiaSeychellesSierra LeoneSingaporeSlovak RepublicSloveniaSmall statesSolomon IslandsSouth AfricaSouth AsiaSouth Asia (IDA & IBRD)South SudanSpainSri LankaSt. Kitts and NevisSt. LuciaSt. Vincent and the GrenadinesSub-Saharan Africa Sub-Saharan Africa (excluding high income)Sub-Saharan Africa (IDA & IBRD countries)SudanSurinameSwazilandSwedenSwitzerlandSyrian Arab RepublicTajikistanTanzaniaThailandTimor-LesteTogoTongaTrinidad and TobagoTunisiaTurkeyTurkmenistanTurks and Caicos IslandsTuvaluUgandaUkraineUnited Arab EmiratesUnited KingdomUnited StatesUpper middle incomeUruguayVanuatuVenezuela, RBVietnamWest Bank and GazaWorldYemen, Rep.ZambiaZimbabwe
La ligne de temps
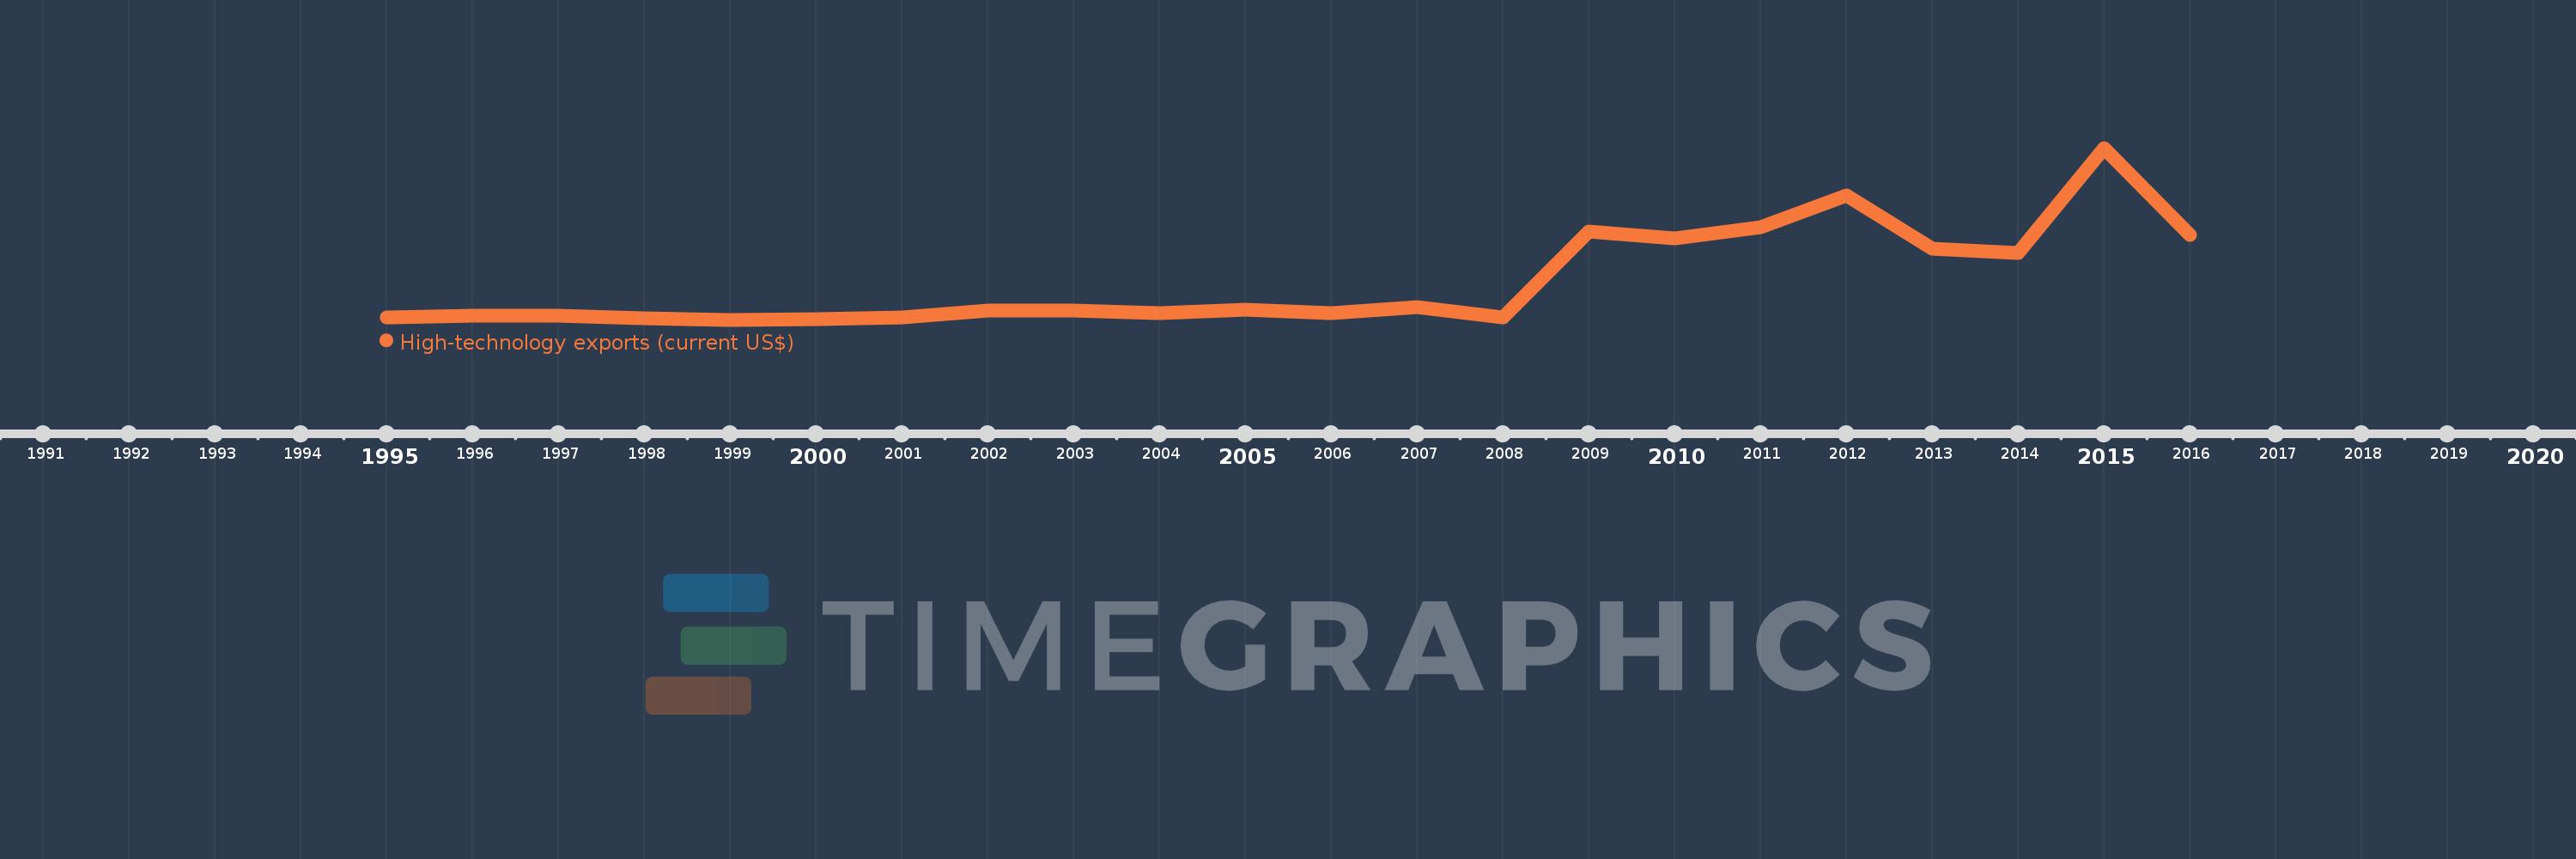
Cette échelle de temps montre un graphique de 1995 année à 2016 année Egypt, Arab Rep.. Les données jusqu'à 1994 année ne sont pas présentés. Quantité d'observations actuelles selon dates: 22.
Source (désignation):
Les indicateurs du développement mondiale
Source (organisation):
United Nations, Comtrade database.
Catégories:
Private Sector, Science & Technology, Trade
Dernière mise à jour
23 avr. 2017
Les indicateurs de changement de valeurs selon les années
En moyenne:
42.188 mln.
Minimum:
3.126 mln.
1 janv. 1999
Maximum:
176.346 mln.
1 janv. 2015
Pour la date d''observation
Valeur
Changement absolu
Le changement par rapport à la valeur précédente
1 janv. 1995
5.575 mln.
+5.575 mln.
0.0%
1 janv. 1996
7.445 mln.
+1.869 mln.
33.53%
1 janv. 1997
7.203 mln.
-242.008 milles
-3.25%
1 janv. 1998
4.321 mln.
-2.882 mln.
-40.01%
1 janv. 1999
3.126 mln.
-1.195 mln.
-27.65%
1 janv. 2000
3.458 mln.
+332.349 milles
10.63%
1 janv. 2001
5.591 mln.
+2.133 mln.
61.67%
1 janv. 2002
12.215 mln.
+6.624 mln.
118.48%
1 janv. 2003
12.779 mln.
+564.268 milles
4.62%
1 janv. 2004
10.008 mln.
-2.771 mln.
-21.68%
1 janv. 2005
13.508 mln.
+3.5 mln.
34.98%
1 janv. 2006
10.123 mln.
-3.386 mln.
-25.07%
1 janv. 2007
15.834 mln.
+5.711 mln.
56.42%
1 janv. 2008
5.729 mln.
-10.104 mln.
-63.81%
1 janv. 2009
91.899 mln.
+86.169 mln.
1.5 milles%
1 janv. 2010
85.284 mln.
-6.615 mln.
-7.2%
1 janv. 2011
96.229 mln.
+10.945 mln.
12.83%
1 janv. 2012
128.064 mln.
+31.835 mln.
33.08%
1 janv. 2013
74.588 mln.
-53.476 mln.
-41.76%
1 janv. 2014
70.412 mln.
-4.176 mln.
-5.6%
1 janv. 2015
176.346 mln.
+105.933 mln.
150.45%
1 janv. 2016
88.39 mln.
-87.955 mln.
-49.88%
Classement des pays selon les statistiques actuelles par années

Commentaires:

Envoyer
PremiumAbout & FeedbackUn accordConfidentialité
logo
© 2022 Selected Technologies LLC – Morgan Hill, California