33
/fr/
AIzaSyAYiBZKx7MnpbEhh9jyipgxe19OcubqV5w
August 1, 2025
104963
Chile
CHL
true
2
1
High-technology exports (current US$)
2016,2015,2014,2013,2012,2011,2010,2009,2008,2007,2006,2005,2004,2003,2002,2001,2000,1999,1998,1997,1996,1995,1994,1993,1992,1991
Download
Bibliothèque de statistiques globales →Chile →

High-technology exports (current US$)

Cette statistique dans les autres pays:

AlbaniaAlgeriaAndorraAntigua and BarbudaArab WorldArgentinaArmeniaArubaAustraliaAustriaAzerbaijanBahamas, TheBahrainBangladeshBarbadosBelarusBelgiumBelizeBeninBermudaBhutanBoliviaBosnia and HerzegovinaBotswanaBrazilBrunei DarussalamBulgariaBurkina FasoBurundiCabo VerdeCambodiaCameroonCanadaCaribbean small statesCentral African RepublicCentral Europe and the BalticsChileChinaColombiaComorosCongo, Rep.Costa RicaCote d'IvoireCroatiaCubaCyprusCzech RepublicDenmarkDjiboutiDominicaDominican RepublicEarly-demographic dividendEast Asia & PacificEcuadorEgypt, Arab Rep.El SalvadorEritreaEstoniaEthiopiaEuro areaEurope & Central AsiaEurope & Central Asia (excluding high income)Europe & Central Asia (IDA & IBRD countries)European UnionFaroe IslandsFijiFinlandFranceFrench PolynesiaGabonGambia, TheGeorgiaGermanyGhanaGreeceGreenlandGrenadaGuatemalaGuineaGuinea-BissauGuyanaHaitiHeavily indebted poor countries (HIPC)High incomeHondurasHong Kong SAR, ChinaHungaryIBRD onlyIcelandIDA & IBRD totalIDA blendIDA onlyIDA totalIndiaIndonesiaIran, Islamic Rep.IraqIrelandIsraelItalyJamaicaJapanJordanKazakhstanKenyaKiribatiKorea, Rep.KuwaitKyrgyz RepublicLate-demographic dividendLatin America & Caribbean Latin America & Caribbean (excluding high income)Latin America & the Caribbean (IDA & IBRD countries)LatviaLebanonLesothoLithuaniaLow & middle incomeLow incomeLower middle incomeLuxembourgMacao SAR, ChinaMacedonia, FYRMadagascarMalawiMalaysiaMaldivesMaliMaltaMauritiusMexicoMiddle East & North AfricaMiddle East & North Africa (excluding high income)Middle East & North Africa (IDA & IBRD countries)Middle incomeMoldovaMongoliaMontenegroMoroccoMozambiqueMyanmarNamibiaNepalNetherlandsNew CaledoniaNew ZealandNicaraguaNigerNigeriaNorth AmericaNorwayOECD membersOmanOther small statesPakistanPalauPanamaPapua New GuineaParaguayPeruPhilippinesPolandPortugalPost-demographic dividendQatarRomaniaRussian FederationRwandaSamoaSao Tome and PrincipeSaudi ArabiaSenegalSerbiaSeychellesSierra LeoneSingaporeSlovak RepublicSloveniaSmall statesSolomon IslandsSouth AfricaSouth AsiaSouth Asia (IDA & IBRD)South SudanSpainSri LankaSt. Kitts and NevisSt. LuciaSt. Vincent and the GrenadinesSub-Saharan Africa Sub-Saharan Africa (excluding high income)Sub-Saharan Africa (IDA & IBRD countries)SudanSurinameSwazilandSwedenSwitzerlandSyrian Arab RepublicTajikistanTanzaniaThailandTimor-LesteTogoTongaTrinidad and TobagoTunisiaTurkeyTurkmenistanTurks and Caicos IslandsTuvaluUgandaUkraineUnited Arab EmiratesUnited KingdomUnited StatesUpper middle incomeUruguayVanuatuVenezuela, RBVietnamWest Bank and GazaWorldYemen, Rep.ZambiaZimbabwe

La ligne de temps

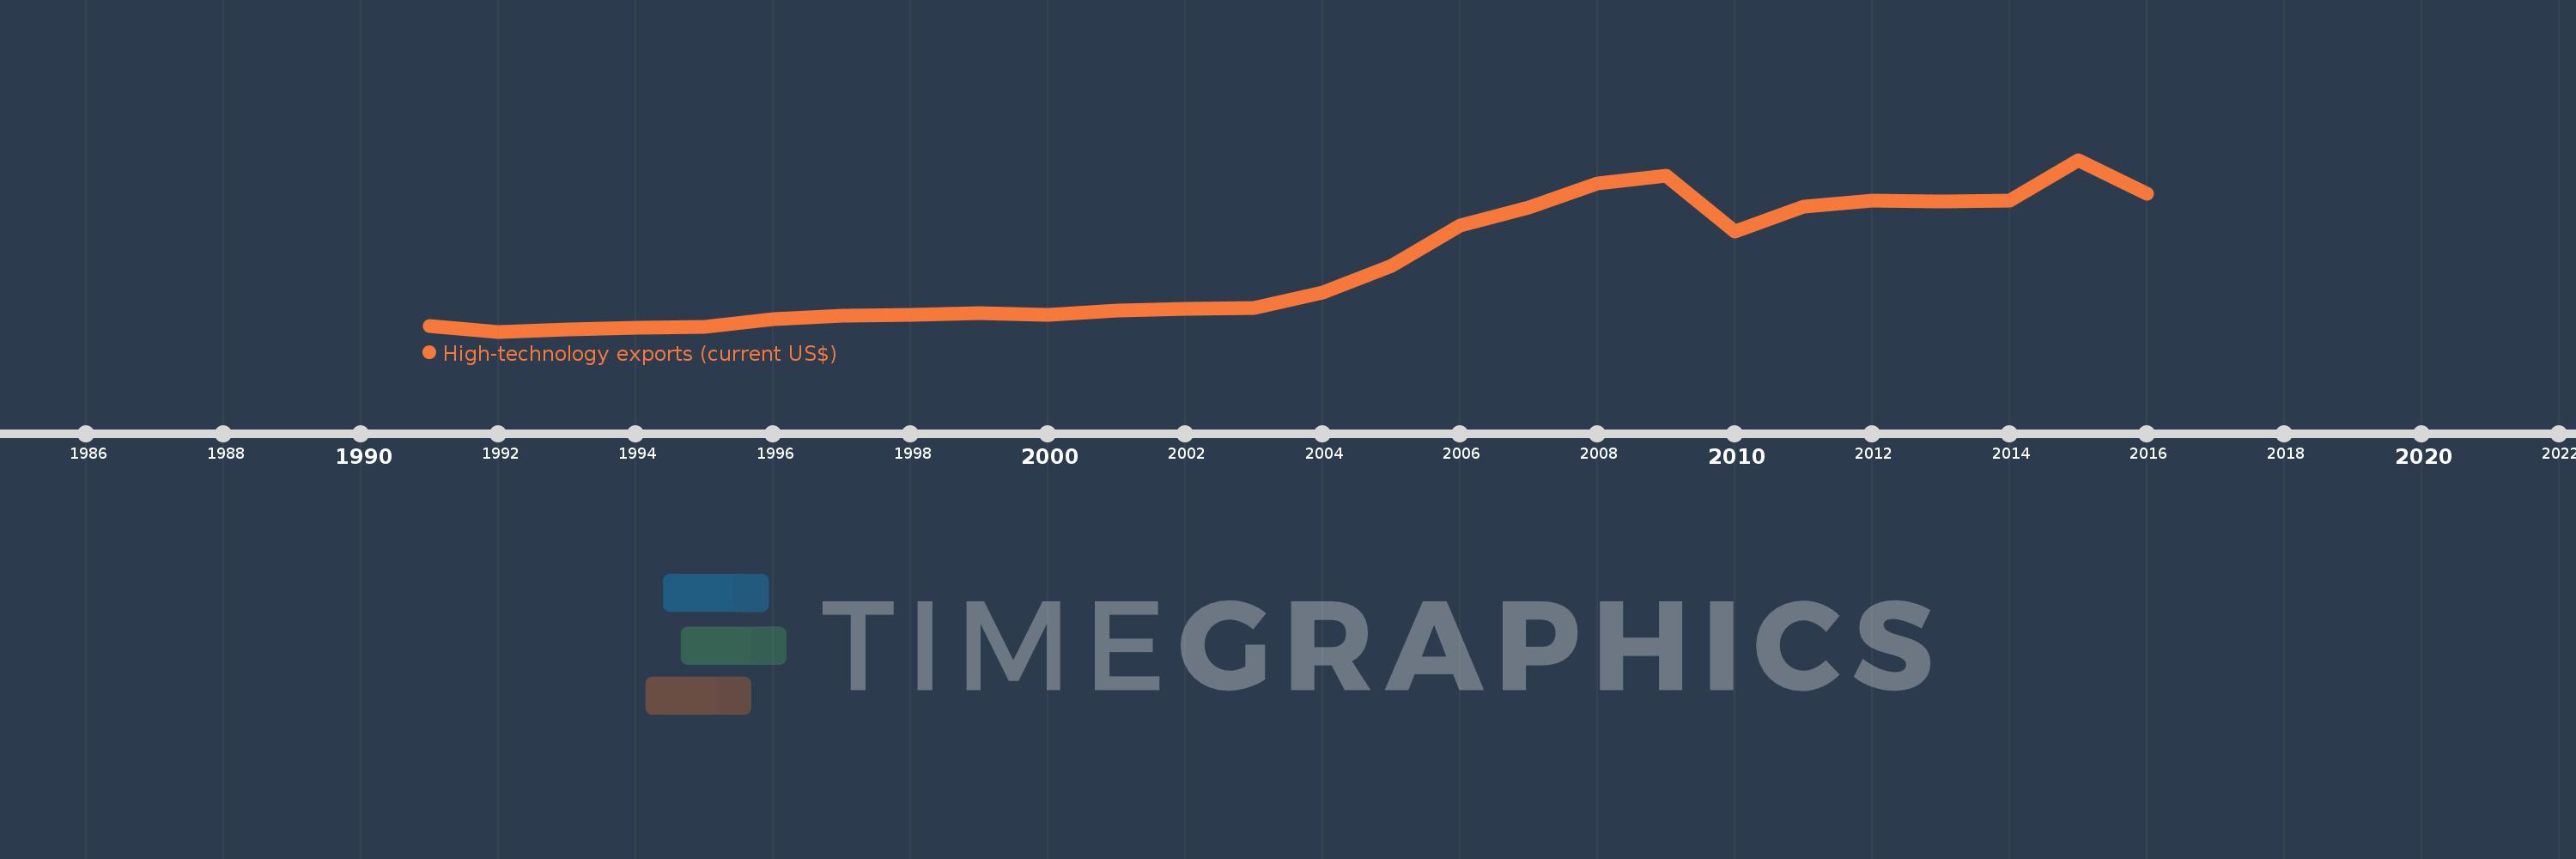
Cette échelle de temps montre un graphique de 1991 année à 2016 année Chile. Les données jusqu'à 1990 année ne sont pas présentés. Quantité d'observations actuelles selon dates: 26.

Source (désignation):

Les indicateurs du développement mondiale

Source (organisation):

United Nations, Comtrade database.

Catégories:

Private Sector, Science & Technology, Trade

Dernière mise à jour

23 avr. 2017

Les indicateurs de changement de valeurs selon les années

En moyenne:
268.962 mln.
Minimum:
22.771 mln.
1 janv. 1992
Maximum:
658.843 mln.
1 janv. 2015
Pour la date d''observation
Valeur
Changement absolu
Le changement par rapport à la valeur précédente
1 janv. 1991
43.686 mln.
+43.686 mln.
0.0%
1 janv. 1992
22.771 mln.
-20.916 mln.
-47.88%
1 janv. 1993
31.056 mln.
+8.285 mln.
36.38%
1 janv. 1994
35.695 mln.
+4.639 mln.
14.94%
1 janv. 1995
40.045 mln.
+4.35 mln.
12.19%
1 janv. 1996
69.932 mln.
+29.888 mln.
74.64%
1 janv. 1997
80.43 mln.
+10.497 mln.
15.01%
1 janv. 1998
84.402 mln.
+3.972 mln.
4.94%
1 janv. 1999
92.361 mln.
+7.959 mln.
9.43%
1 janv. 2000
83.719 mln.
-8.642 mln.
-9.36%
1 janv. 2001
99.13 mln.
+15.411 mln.
18.41%
1 janv. 2002
105.903 mln.
+6.773 mln.
6.83%
1 janv. 2003
110.617 mln.
+4.714 mln.
4.45%
1 janv. 2004
168.562 mln.
+57.945 mln.
52.38%
1 janv. 2005
265.704 mln.
+97.141 mln.
57.63%
1 janv. 2006
415.258 mln.
+149.555 mln.
56.29%
1 janv. 2007
483.239 mln.
+67.981 mln.
16.37%
1 janv. 2008
571.705 mln.
+88.466 mln.
18.31%
1 janv. 2009
599.123 mln.
+27.418 mln.
4.8%
1 janv. 2010
393.89 mln.
-205.233 mln.
-34.26%
1 janv. 2011
486.84 mln.
+92.95 mln.
23.6%
1 janv. 2012
507.253 mln.
+20.413 mln.
4.19%
1 janv. 2013
503.029 mln.
-4.223 mln.
-0.83%
1 janv. 2014
507.844 mln.
+4.814 mln.
0.96%
1 janv. 2015
658.843 mln.
+150.999 mln.
29.73%
1 janv. 2016
531.986 mln.
-126.857 mln.
-19.25%

Classement des pays selon les statistiques actuelles par années