33
/fr/
AIzaSyAYiBZKx7MnpbEhh9jyipgxe19OcubqV5w
August 1, 2025
176482
Lebanon
LBN
true
2
1
High-technology exports (current US$)
2015,2014,2013,2012,2011,2010,2009,2008,2007,2006,2005,2004,2003,2002,2001,2000,1999,1998
Download
Bibliothèque de statistiques globales →Lebanon →

High-technology exports (current US$)

Cette statistique dans les autres pays:

AlbaniaAlgeriaAndorraAntigua and BarbudaArab WorldArgentinaArmeniaArubaAustraliaAustriaAzerbaijanBahamas, TheBahrainBangladeshBarbadosBelarusBelgiumBelizeBeninBermudaBhutanBoliviaBosnia and HerzegovinaBotswanaBrazilBrunei DarussalamBulgariaBurkina FasoBurundiCabo VerdeCambodiaCameroonCanadaCaribbean small statesCentral African RepublicCentral Europe and the BalticsChileChinaColombiaComorosCongo, Rep.Costa RicaCote d'IvoireCroatiaCubaCyprusCzech RepublicDenmarkDjiboutiDominicaDominican RepublicEarly-demographic dividendEast Asia & PacificEcuadorEgypt, Arab Rep.El SalvadorEritreaEstoniaEthiopiaEuro areaEurope & Central AsiaEurope & Central Asia (excluding high income)Europe & Central Asia (IDA & IBRD countries)European UnionFaroe IslandsFijiFinlandFranceFrench PolynesiaGabonGambia, TheGeorgiaGermanyGhanaGreeceGreenlandGrenadaGuatemalaGuineaGuinea-BissauGuyanaHaitiHeavily indebted poor countries (HIPC)High incomeHondurasHong Kong SAR, ChinaHungaryIBRD onlyIcelandIDA & IBRD totalIDA blendIDA onlyIDA totalIndiaIndonesiaIran, Islamic Rep.IraqIrelandIsraelItalyJamaicaJapanJordanKazakhstanKenyaKiribatiKorea, Rep.KuwaitKyrgyz RepublicLate-demographic dividendLatin America & Caribbean Latin America & Caribbean (excluding high income)Latin America & the Caribbean (IDA & IBRD countries)LatviaLebanonLesothoLithuaniaLow & middle incomeLow incomeLower middle incomeLuxembourgMacao SAR, ChinaMacedonia, FYRMadagascarMalawiMalaysiaMaldivesMaliMaltaMauritiusMexicoMiddle East & North AfricaMiddle East & North Africa (excluding high income)Middle East & North Africa (IDA & IBRD countries)Middle incomeMoldovaMongoliaMontenegroMoroccoMozambiqueMyanmarNamibiaNepalNetherlandsNew CaledoniaNew ZealandNicaraguaNigerNigeriaNorth AmericaNorwayOECD membersOmanOther small statesPakistanPalauPanamaPapua New GuineaParaguayPeruPhilippinesPolandPortugalPost-demographic dividendQatarRomaniaRussian FederationRwandaSamoaSao Tome and PrincipeSaudi ArabiaSenegalSerbiaSeychellesSierra LeoneSingaporeSlovak RepublicSloveniaSmall statesSolomon IslandsSouth AfricaSouth AsiaSouth Asia (IDA & IBRD)South SudanSpainSri LankaSt. Kitts and NevisSt. LuciaSt. Vincent and the GrenadinesSub-Saharan Africa Sub-Saharan Africa (excluding high income)Sub-Saharan Africa (IDA & IBRD countries)SudanSurinameSwazilandSwedenSwitzerlandSyrian Arab RepublicTajikistanTanzaniaThailandTimor-LesteTogoTongaTrinidad and TobagoTunisiaTurkeyTurkmenistanTurks and Caicos IslandsTuvaluUgandaUkraineUnited Arab EmiratesUnited KingdomUnited StatesUpper middle incomeUruguayVanuatuVenezuela, RBVietnamWest Bank and GazaWorldYemen, Rep.ZambiaZimbabwe

La ligne de temps

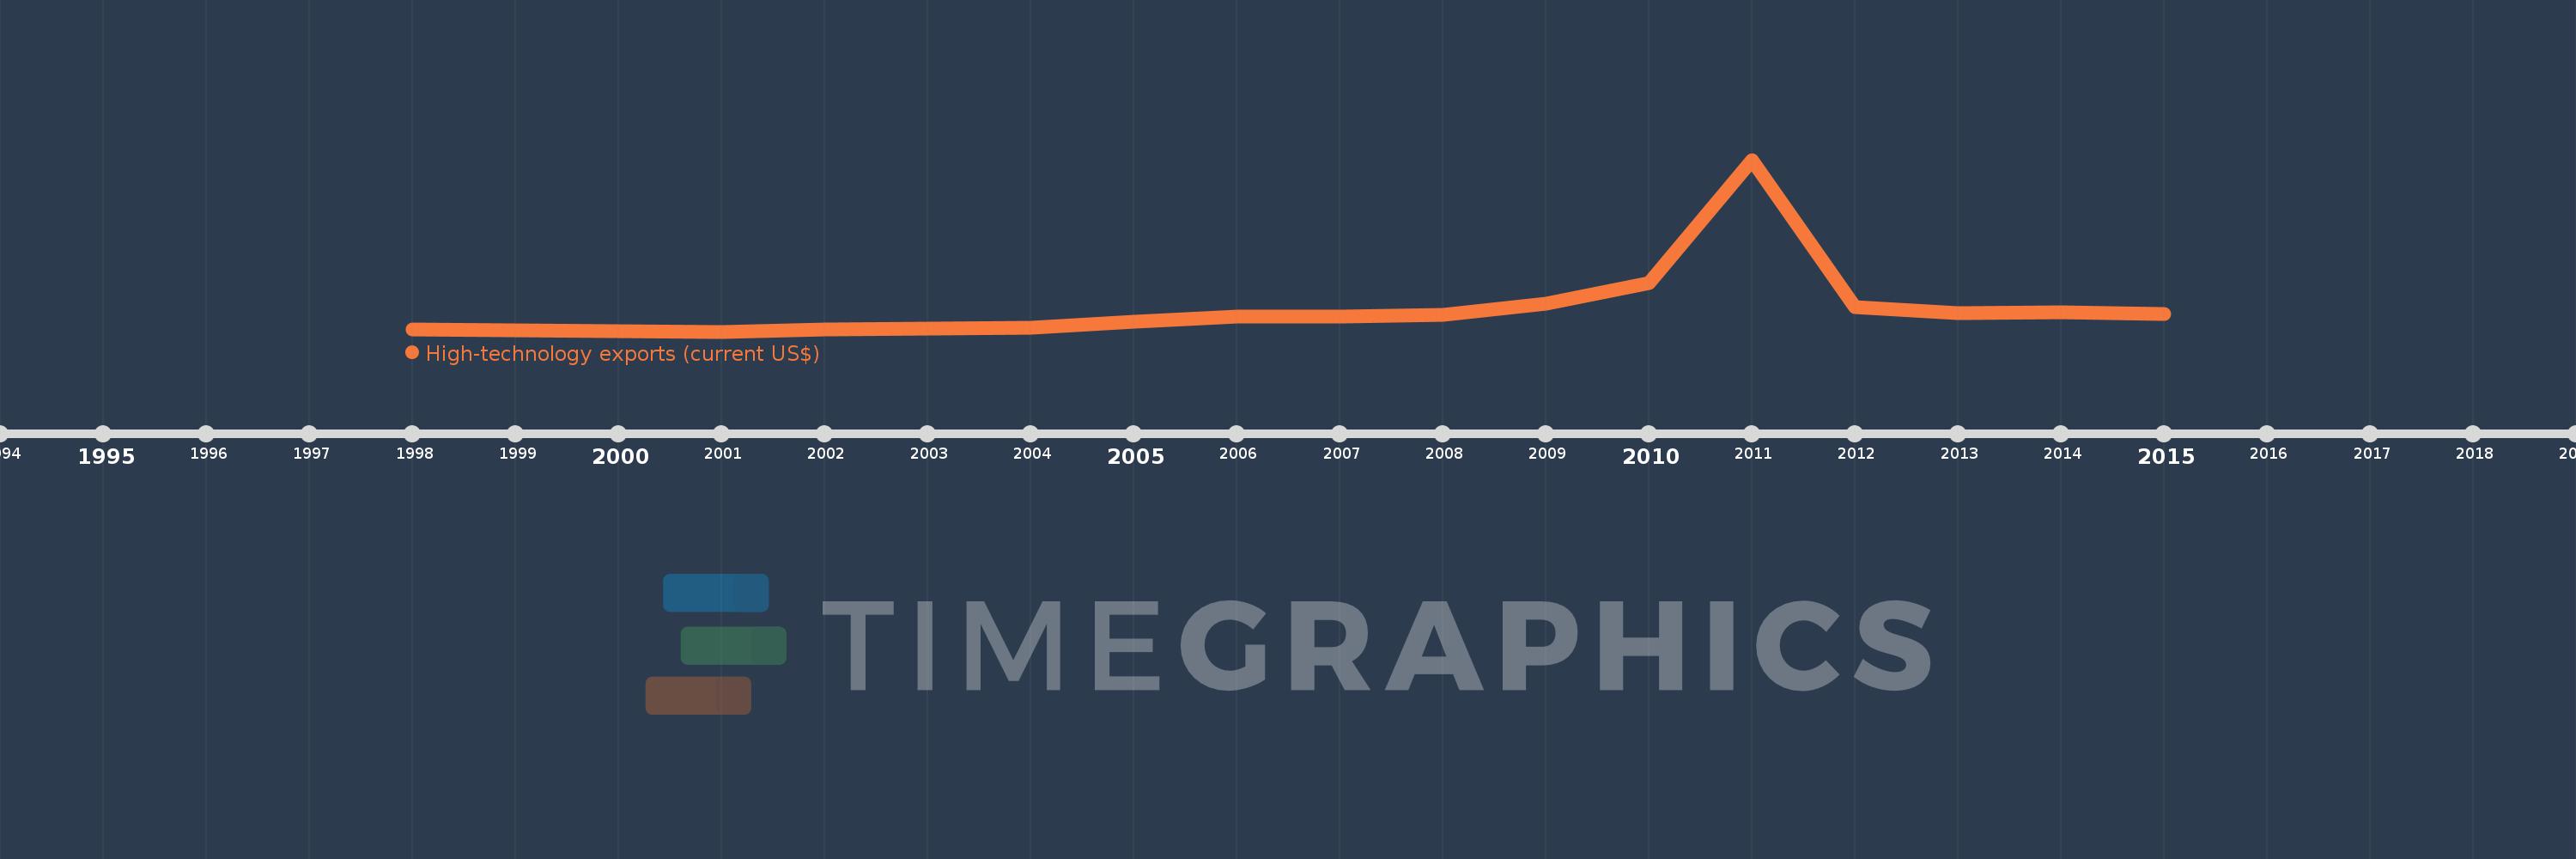
Cette échelle de temps montre un graphique de 1998 année à 2015 année Lebanon. Les données jusqu'à 1997 année ne sont pas présentés. Quantité d'observations actuelles selon dates: 18.

Source (désignation):

Les indicateurs du développement mondiale

Source (organisation):

United Nations, Comtrade database.

Catégories:

Private Sector, Science & Technology, Trade

Dernière mise à jour

23 avr. 2017

Les indicateurs de changement de valeurs selon les années

En moyenne:
45.513 mln.
Minimum:
11.05 mln.
1 janv. 2001
Maximum:
278.556 mln.
1 janv. 2011
Pour la date d''observation
Valeur
Changement absolu
Le changement par rapport à la valeur précédente
1 janv. 1998
14.516 mln.
+14.516 mln.
0.0%
1 janv. 1999
13.474 mln.
-1.042 mln.
-7.18%
1 janv. 2000
11.193 mln.
-2.281 mln.
-16.93%
1 janv. 2001
11.05 mln.
-143.539 milles
-1.28%
1 janv. 2002
14.178 mln.
+3.128 mln.
28.31%
1 janv. 2003
15.692 mln.
+1.515 mln.
10.68%
1 janv. 2004
16.995 mln.
+1.303 mln.
8.3%
1 janv. 2005
26.474 mln.
+9.479 mln.
55.77%
1 janv. 2006
34.52 mln.
+8.046 mln.
30.39%
1 janv. 2007
35.102 mln.
+581.735 milles
1.69%
1 janv. 2008
37.477 mln.
+2.376 mln.
6.77%
1 janv. 2009
55.104 mln.
+17.626 mln.
47.03%
1 janv. 2010
86.79 mln.
+31.687 mln.
57.5%
1 janv. 2011
278.556 mln.
+191.766 mln.
220.95%
1 janv. 2012
49.364 mln.
-229.192 mln.
-82.28%
1 janv. 2013
39.299 mln.
-10.065 mln.
-20.39%
1 janv. 2014
41.298 mln.
+1.999 mln.
5.09%
1 janv. 2015
38.147 mln.
-3.152 mln.
-7.63%

Classement des pays selon les statistiques actuelles par années